COMING SOON: A PYTHON LIBRARY FOR INTERACTING WITH UDP DATA
05 September, 2019 – Written by Ian Nesbitt
Hola Shakers
Ian from Shake Technical Support here!
I thought I’d share a bit of a sneak preview of something I’m working on right now. Many of you know that all Shakes have the ability to forward UDP data to a set of IP addresses, but perhaps not all of you have had a chance to see how useful and cool of a functionality that is.
For the past few months I’ve been writing (and re-writing) a Python library that allows you to make easy use of our UDP streams. When it’s all done, the program will be able to:
- Read multiple channels of UDP data directly to an obspy stream
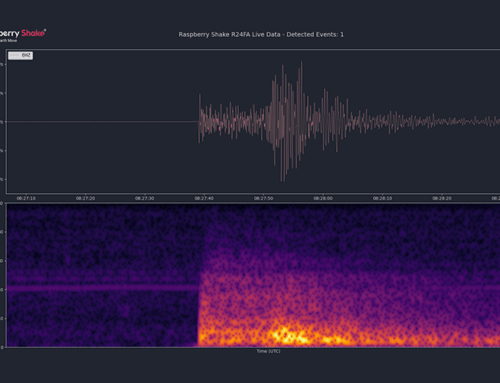
- Display live-updating seismogram or seismogram-spectrogram animation plots that show you what the Shake is recording at that exact moment and for a specified period of past data (see screenshots below)
- Set up a customizable Shake Notification system, which executes some task when an algorithmic earthquake detector (like a STA-LTA or other fast detection algorithm) triggers based on some custom criteria
- Utilize multi-threading support using queues (meaning that the features described in all of the previous bullet points can execute simultaneously, independently of the others)
- Allow for other processes to be spun up as threads in a modular fashion, so that you can write your own processing methods to work with live UDP data
…and perhaps other features not listed here.
For those readers not inclined to write programs, Python or otherwise, you will be able to start the program from the command line, as easily as logging into the Shake using SSH.
LIVE-PLOT SCREENSHOTS
Check out some of the seismogram-spectrogram plots I’ve been working on. If you’re not familiar with spectrograms, they are a way to break down a signal and visually display the power associated with the spectrum of frequencies that make up that signal over time. The spectrogram’s color map is perceptually linear (meaning that it is colorblind-friendly) and I think it both looks good and does a great job at showing changes in spectral power!
At my house the other day I caught the end of a washer spin cycle and the start of the next:


A few days ago I had the great fortune of recording a Panamanian earthquake live on my laptop, as I was working on this same program:

Here I demonstrate plotting all four channels of an RS4D at once. The noise you can see on EHZ (top) and ENZ (bottom) in this plot is me drumming my feet on the ground for demonstration purposes:

LIVE ACTION
Here’s a quick demonstration of live-plotting in action:
We will likely be releasing this library with version 16 of the Shake OS, both as a download available from the Shake’s web front-end, and as a Python package available on PyPI for easy installation with pip.
I am excited to be able to share this software with you and to see what cool and useful things you all make with it!
Chao from Panama,
Ian