

Watching Waveforms!
Jump! Understand seismographs with this fun, interactive, and hands-on activity.
Summary
Having a seismograph in the classroom is an excellent opportunity to demonstrate physics and Earth science concepts to students in a hands-on and interactive activity. In this activity, they will explore how acoustic energy waves are recorded by seismographs, how they lose energy over distance (attenuation), and why different actions cause different waveforms.
Pre-Class Preparation
- Print the student worksheet (you can also decide to have the students copy the worksheet in a notebook)
- Ensure that there is a functioning system (a separate computer, most likely) in place for the Raspberry Shake to stream live, real-time data for your classroom to view during this activity. You can find tips and instructions for that here.
- Clear a space in the front of the class on the floor for the sensor
It is important that the students can see what they are jumping for! The best way to do this is to ensure the Raspberry Shake has a long Ethernet connection and a long extension cord that allows it to be easily moved without disconnecting the device.
Procedure
Students will explore and experience what seismographs are and how they work by interacting with one in real time. Different jumping tests will be performed by changing variables like distance, duration, and mass. The students will practice being scientists by making observations and inferences.
Step 1 — Introduction and planning
To start the class, briefly introduce the students to the concept of a seismograph! A seismograph records ground movement (shaking) and it is used by scientists to detect and record earthquakes. Here you can introduce them to the live waveform graph that is on the monitor.
Be careful not to give the students too much of an explanation — they will get a hands-on understanding soon!
Plan the process with the students:
- The class decides together who will be the “jumper”
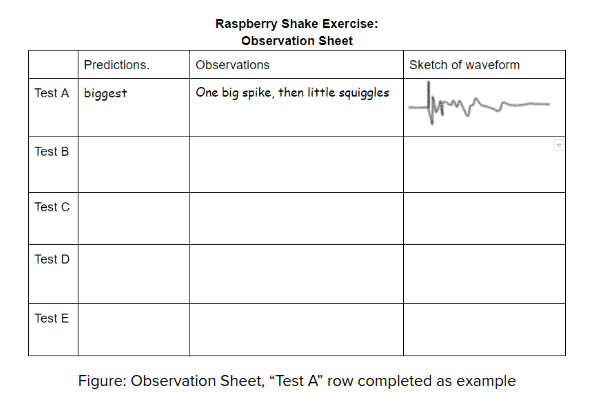
- Instruct the students on how to fill out the “Observation Sheet”
- Encourage students to make qualitative observations like “one, tall spike” or “many, little waves”
Step 2 — Making predictions
Hand out the worksheet, or instruct the students to copy the chart into their notebooks. Give students 5 scenarios:
- Test A: One person jumps once, very close to sensor
- Test B: One person jumps once, 10 feet away
- Test C: One person stomps their feet for 5 seconds, 5 feet away
- Test D: Everyone jumps once, all at the same time
- Test E: Everyone stomps their feet as hard as they can for 5 seconds
Which will make the biggest change in the graph? Rate them 1 – 5, higher numbers being more change. Fill out the first column on the worksheet.
Step 3 — Jump and Shake!
Complete the first test, Test A. Once the “jumper” jumps, it may take a few seconds for the data to register on the monitor.
- Take notes of the observations
- Try to sketch the form of the graph in the space provided
- Allow time for the graph to reset after each test
- Repeat this process for tests B through E
Closing/Reflection
Start a conversation with the students:
- What did we learn?
- What conclusions can we make?
- Was anything surprising?
- How does this activity relate to the real world?
Build Your Own Seismograph
Deepen your understanding and appreciation for seismographs by building your own
Summary
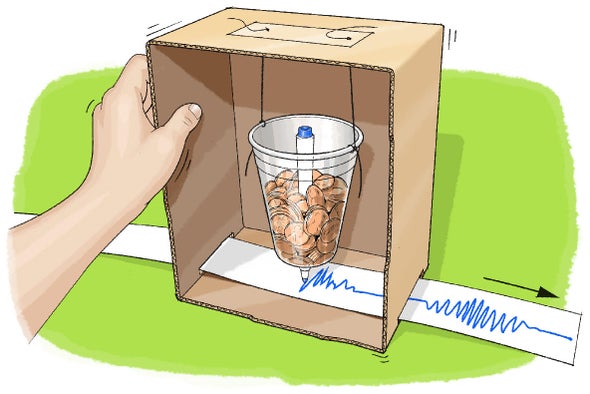
Help your students understand how the Raspberry Shake (and other seismographs) work by building their own simple seismograph, using everyday school supplies. Then compare and contrast the student’s home-made seismograph to the Raspberry Shake!
Pre-Class Preparation
- Download and follow IRIS’s Build your own seismograph activity with your students.
- It is important to have sufficient materials to allow the students to build the seismograph. Materials include boxes, pencils, paper, string, tape, paper/plastic cups, coins…
- To further prepare and understand the project, there are many YouTube demonstrations and tutorials that you, as a teacher, can watch ahead of time
- Ensure that there is a functioning system (a separate computer, most likely) in place for the Raspberry Shake to stream live, real-time data for your classroom to view during this activity. You can find tips and instructions for that here.
Procedure
The activity is divided into three main phases: Plan, Build, and Test & Compare.
Plan
Students think of ways to build a simple device that will record ground motion. Draw plans out on a piece of paper, and plan the materials needed.
Do not give much instructions!
Build
In small groups of 3–4 students, students design and construct a seismograph using common household and craft materials provided. Each group will demonstrate to the class (by shaking their table) how their seismograph records motion.
Test and Compare
Test your seismograph! Shake the desk that the seismograph is on, and (if applicable) move the “recording paper” to see movement over time.
At the same time, place the Raspberry Shake seismograph on the desk and watch the graph that results from the shaking. Think about the similarities and differences between the geophone, the ground motion sensor used in the Raspberry Shake, and the sensor for your homemade seismograph.
Closing/Reflection
Start a conversation with the students about the activity:
- How could the design be improved?
- What were the biggest differences between the home-made seismograph and Raspberry Shake? Similarities?
- Were there any difficulties building your seismograph?
- Does building a seismograph help you understand what goes on inside a geophone? Why?
Wave Transfer Experiment!
Explore how energy is conducted through different types of matter and materials
Summary
Students will understand how different mediums are better at transferring energy than others, through this experiment with the Raspberry Shake, by observing how waveforms change depending on the material that the sensor sits upon. Scientists call this transfer of energy waves wave propagation. Concepts explored in this experiment can be connected to the real-world application of building and engineering in earthquake-prone areas.
Pre-Class Preparation
- Print the student worksheet (you can also decide to have the students copy the worksheet in a notebook)
- Ensure that there is a functioning system for the Raspberry Shake to stream live, real-time data
- Clear a space in the front of the class on the floor for the sensor
- Make sure that your Raspberry Shake is in a position where it can be easily manipulated and placed on top of different objects
The best way to do this is to ensure the Raspberry Shake has a long Ethernet connection and a long extension cord that allows it to be easily moved without disconnecting the device.
Materials
- Raspberry Shake
- Computer and monitor for displaying RS data
- Small table/chair
- A pillow, a cushion, or foam
- Text books
- Plastic bag filled with water (very securely sealed!)
- Plastic bag filled with air
For the bags, we recommend strong, plastic Zip-Lock type bags. BE CAREFUL!! Extra precaution is advised. Electronics and water are not the best of friends, so this is at your own risk.
Procedure
In this activity, students will investigate how different mediums transfer energy. When someone jumps, the energy is released from the ground and transfers through the floor, and is recorded by the Raspberry Shake seismograph. What happens to the energy as it goes through different substances and materials? In this activity, students will explore that question.
Step 1 — Introduction and planning
The Raspberry Shake seismograph is extremely portable, and because of its small size can be easily moved around, placed on top of different materials, and be recording data the whole time! Because the sensitive geophone on the Shake detects any motion/energy that passes under it, it can be used to investigate how energy waves get stronger or weaker according to the substance they are passing through.
- Decide on a repeatable way in which your students will create ground motion
- Introduce the students to the “Observation Sheet”
- Encourage students to make observations like “one, tall spike” or “many, little waves”
Step 2 — Get Shaking!
Gather the students near the monitor to watch the graph closely. Complete the following tests:
- Test A: Control – Raspberry Shake is placed on the floor
- Test B: Elevated – Sensor is placed on a chair or desk
- Test C: Cushioned – Sensor is placed on a cushion or pillow
- Test D: Liquid – Sensor is placed on a plastic bag full of water
- Test E: Air – Sensor is placed on a plastic bag full of air
When energy release occurs, it may take a few seconds for the data to register on the monitor. Allow time for the graph to reset after each test before proceeding to the next one.
Conclusions and Reflections
Start a conversation with the students:
- What did we learn?
- Why is what we just learned important?
- What real-world applications could benefit from having this kind of knowledge?
Reinforce the real-world connection to engineering. Understanding how different materials transfer energy can be very important to architects and civil engineers when they construct buildings or plan developments. It is always helpful to understand how the world around us works.