DATAVIEW: OFFICIAL RELEASE OF OUR ADVANCED DATA VISUALIZATION TOOL

DataView is a software application designed for more advanced users to view data from all Raspberry Shake stations, all channels (geophone vertical, horizontal, accelerometer, and infrasound), over all time, right from your browser.
OVERVIEW
DataView allows you to visualize seismograms and spectrograms and includes filtering and frequency domain analysis.
When opening DataView for the first time you will have the chance to take our interactive tour of the app which we highly recommend. You will notice the left sidebar which lists all Raspberry Shake stations currently connected to the network. On the top right you will see various viewing options and settings.
At the top of the left side bar you can search for any Shake station by name or use the filtering options to find stations of interest. Once you have selected a Shake and the channel you wish to view (geophone vertical, horizontal, accelerometer or infrasound) you can choose between 3 different viewing options; Live Stream, Helicorder and Compare Data. We will look at these in closer detail below.
To the right of the viewing options you can navigate to settings and get more help by starting the on screen tour or going to our support forum.

MAIN VIEWS
For each of the main views the top bar contains informative labels on the left and action buttons on the right.
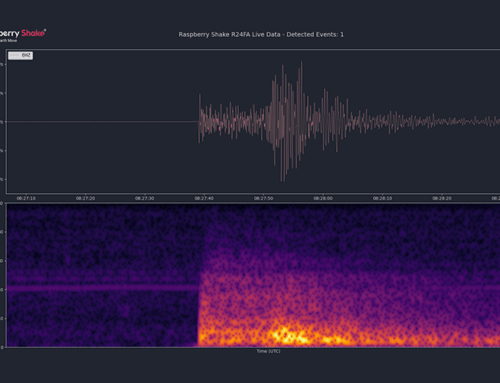
Live Stream
This view shows you the real-time seismogram and spectrogram activity of the selected Shake station.
From the top bar on the left you can select/ deselect a Station to your favorites, see the station name and channel you are viewing, along with some other information as indicated in the tooltips.
On the right side of the top bar you will see 3 action options:
1. Find on map: Opens the Station View web application in a new tab and indicates where the selected station is located on the map.
2. Embed Livestream: Provides you with a code you can copy to embed the live stream of this station onto another website/ service.
3. Filter Options: Select between various filter options to optimize how the data is displayed.

Helicorder
This view shows you all the data recorded in the last 24 hours (default option) on the selected station and channel.
On the left of the top bar you can see the same labels as the Live Stream view (explained above), on the right there are some different actions to choose from.
1. Waveform Processing Method: Optimize how the data is displayed by selecting between the following data processing protocols:
- Root Mean Square (RMS): this will allow automatic helicorder display waveform autoscale
- Amplitude Clipping: this will rescale the helicorder display and avoid issues related to spurious high-amplitude spikes
- Both RMS and Amplitude Clipping
- No processing
2. Filter: Select between helicorder filters and frequency range
3. Find on map: Opens the Station View web application in a new tab and indicates where on the map the selected station is located
4. Date: Select the date you would like to view the 24 hour data plot
5. Amplitude Controls: Click on the up arrows to increase the amplitude of the helicorder and the down arrows to do the opposite. The double arrows up will increase more, and double arrows down will decrease more.

To take a closer look at a specific section of the helicorder simply click on it. A window will open at the top of the helicorder with data from the selected section only. Using your mouse you can drag the selection anywhere on the data plot, and zoom in or out.
Option Buttons on the zoomed in selection:
| Buttons | Funtion |
| Zoom in or out of the waveform window by using the – and + buttons. | |
| Toggle the frequency spectrum view for the selected waveform. | |
| Toggle the spectrogram view for the selected waveform. | |
| Toggle the spectrogram color autoscale | |
| Use one of the four predefined filters, or define one yourself for the selected waveform. The default values (no filter) are -1, -1. | |
| Toggle waveform demeaning. | |
| After you have selected a particular event (or portion of the waveform) that you want to export from DataView, click on this button, and it will generate a composite plot (waveform, spectrogram, frequency spectrum) that you can save as an image on your local device. | |
| Close window and return to the 24 hour display by closing the detailed view window. |

Compare Data
This view allows you to select multiple station channels and compare their real-time data side by side. Your selection is saved between browser sessions so you will easily be able to pick up where you left off, even after restarting your computer.
At the top of each live stream plot you are viewing you can see the station name, select a filter, and see whether or not the station is online and streaming.

SETTINGS
The table below shows the settings options available in DataView:
| Time range field | Extend or lower the total time range that is shown in the main window (default is 24 hours). |
| Track length field | Change the amount of time displayed along the horizontal axis (the lower one) between 30 and 60 minutes (default is 30 minutes). |
| Amplitude Clipping field | Enable/Disable the Amplitude Clipping feature, to rescale the helicorder display and avoid issues related to spurious high-amplitude spikes.
It is possible to input a clipping value in the box or by selecting a portion of the helicorder free from spikes and using the “Clip helicorder with this amplitude range” button in the popup. The highest value in the selected range will be taken as the clipping value, rescaling the entire helicorder plot. When Amplitude Clipping is turned off, RMS autoscale will revert to its previous value. |
| Enable RMS autoscaling field | Enable/Disable the RMS (Root Mean Square) auto scaling feature, that allows automatic helicorder display waveform autoscale.
If both RMS and Amplitude Clipping are turned on, Amplitude Clipping will use the RMS value as a clipping limit. If RMS autoscale is turned off, then it is possible to manually adjust/input the desired clipping value. In both cases, it is possible to re-adjust the clipping value with the “Clip helicorder with this amplitude range” button in the helicorder popup. |
| Amplitude Clipping and Enable RMS autoscaling fields together | If, for your Shake, RMS autoscale and/or Amplitude Clipping worsen the overall helicorder appearance, feel free to disable them and continue using the standard Amplitude commands. |
| Annotate with events field | Toggle the event annotation ON or OFF. The selected Shake has to be close to the earthquake epicenter for this function to provide information. |
| Helicorder Filter field | Create/manage different filters to be applied to the entire static Helicorder view. The default values (no filter) are -1, -1 in both input boxes.
You can add a new filter with the blue button, rename them as you prefer, add a specific High Pass and Low Pass value (where the High Pass value must be less than the Low Pass value, when both values are greater than 0), and delete them with the red button. |
| Real Time field | Change the real-time dynamic livestream window length (accessed through the button) to avoid blank spaces according to what screen and screen resolution you are using. The default is 600 seconds. |
| Entire Spectrogram field | For the spectrogram:
– Define the window length in seconds (default is 2). – Define the overlap ratio (default is 0.5). – Define the presence or absence of smooth transformations (default: absence). – Define the amplification (default is 0). – Define the color gradient between five different color schemes (default: Inferno). -And define the range of the power spectrum (default is -5 to 9). |
| Dark Mode field | Enable/Disable DataView Dark Mode, for use in low/high light environments. |
| Cancel Reset Save buttons | Any modification made in Settings has to be confirmed by clicking on the green Save button. If any error is made, it is possible to ignore any changes by clicking on the red Cancel button or by clicking outside of the Settings popup. If a user desires to reset the Settings to standard, it is possible to do so by clicking on the blue Reset button. |