DETECTING EARTH’S INTERNAL FEATURES USING RASPBERRY SHAKES
09 June, 2020 – Written by Mark Vanstone
Twitter: @wmvanstone

This article describes how I have used seismic waves from strong earthquakes, recorded on Raspberry Shakes across the globe, to detect responses from Earth’s internal features. I am a secondary school science teacher, working in Cornwall, UK and my goals in writing this article are for you to understand the power of the Raspberry Shake network to see inside Earth and to put the records from your seismometer into a global context.
PLOTTING SEISMIC DATA
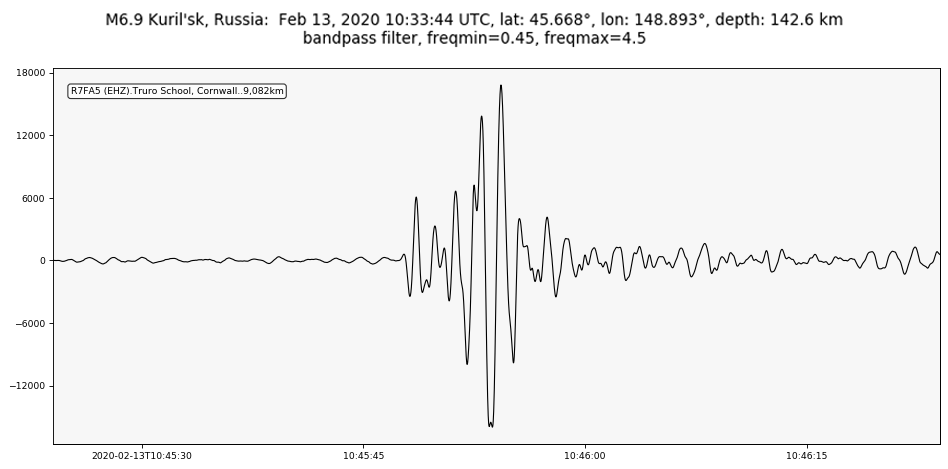
Figure 1: Response to the M 6.9 earthquake from Kuril’sk, Russia, detected in Truro, Cornwall.
Figure 1 is a simple plot featuring the response on Raspberry Shake seismometer R7FA5 in Truro, UK, to a Magnitude 6.9 earthquake in the Kuril’sk Islands, Russia on 13th February 2020. The earthquake was 9,082km away and this is my school’s seismometer.
Figure 2 on the other hand, shows a plot from the same earthquake featuring traces from 62 different seismometers across the globe, with my school seismometer shown in red at about 82°. The horizontal axis shows angular offset from the earthquake, where each degree in offset is approximately 111 km.
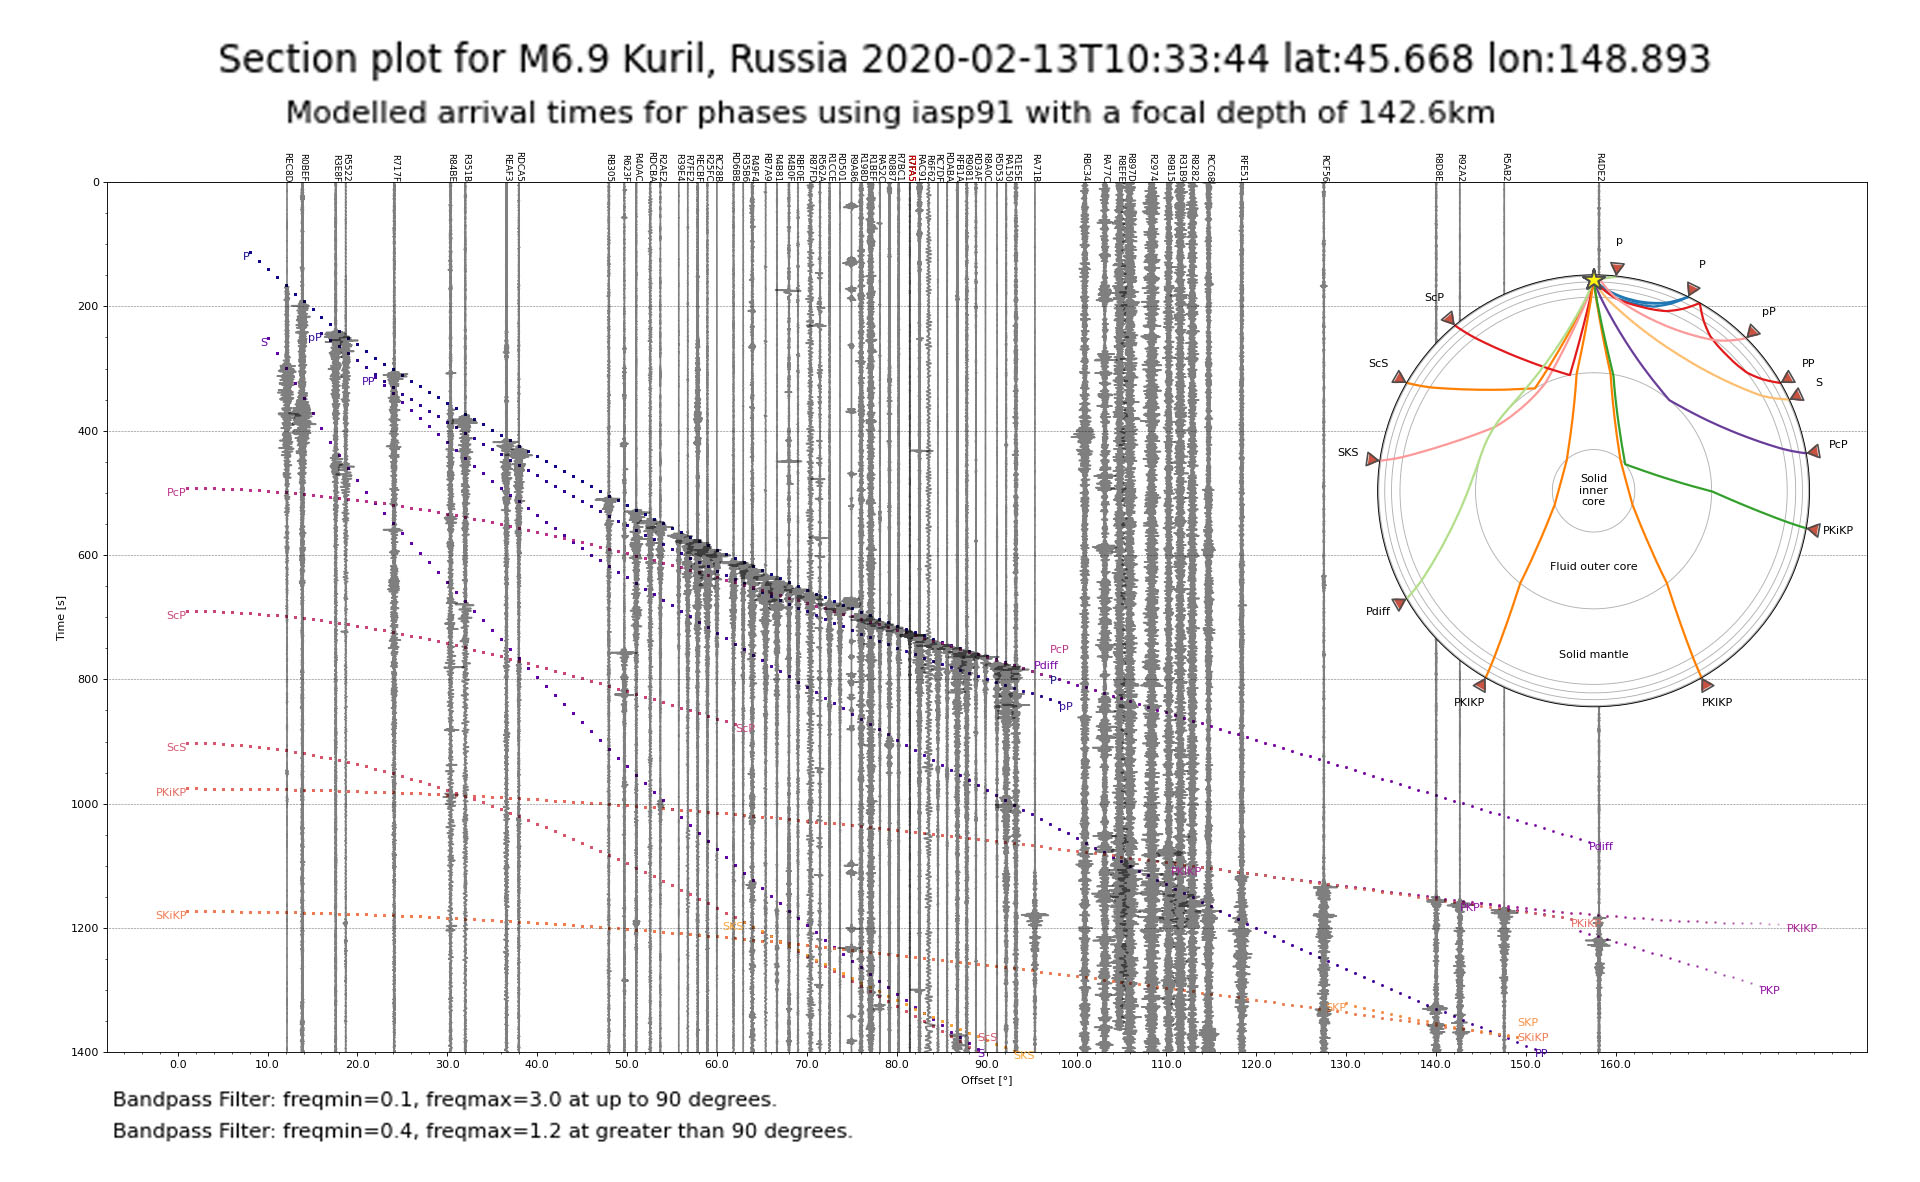
Figure 2: Responses to the M 6.9 earthquake in the Kuril Islands on 13th February 2020, detected across the globe.
The program I have written to generate this plot selects seismometer traces by distance from the source of the earthquake and filters them to remove noise. This happens before plotting them, along with theoretical, named arrival times and a globe showing the pathways followed by the waves. The plot is a fantastic tool for understanding how an individual Raspberry Shake seismometer fits into the global picture created from records of many seismometers across the Raspberry Shake network. That network is reflected in Figure 3, from the the RS Station View site.
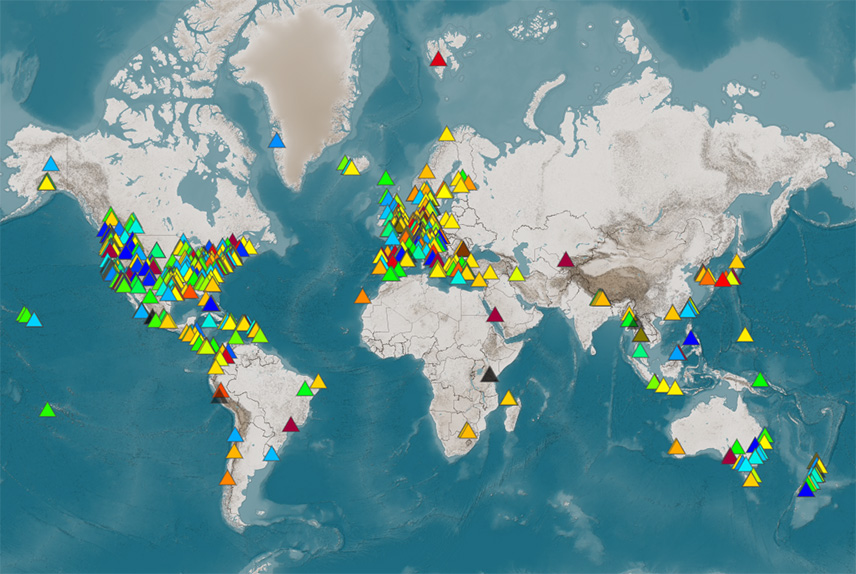
Figure 3: The Raspberry Shake network showing the high density of stations in Europe and North America.
The coloured lines and phase names on the plots come from a model. Therefore they are not picks for the first arrival of actual seismic waves, rather they are theoretical lines generated from a velocity model for Earth. What is amazing is that they closely match the earthquake arrival times observed on the Raspberry Shakes.
KEY FEATURES OF THE PLOTS
In the next few paragraphs, I will explain some of the key features visible on these plots and point out how Raspberry Shake seismometers show evidence of Earth’s main layers.
LOW ANGLE ARRIVALS – CLOSE TO THE EARTHQUAKE
Figure 4 shows arrivals from another earthquake, the Magnitude 6.4 Puerto Rico earthquake on January 7th 2020. This earthquake originated from a source that was just 7.4 km beneath the surface. Traces were detected by the dense North American and European Raspberry Shake networks. I have deliberately created a plot with a high station density, up to 90° from the earthquake, to highlight arrivals at seismometers that are relatively close to the earthquake.
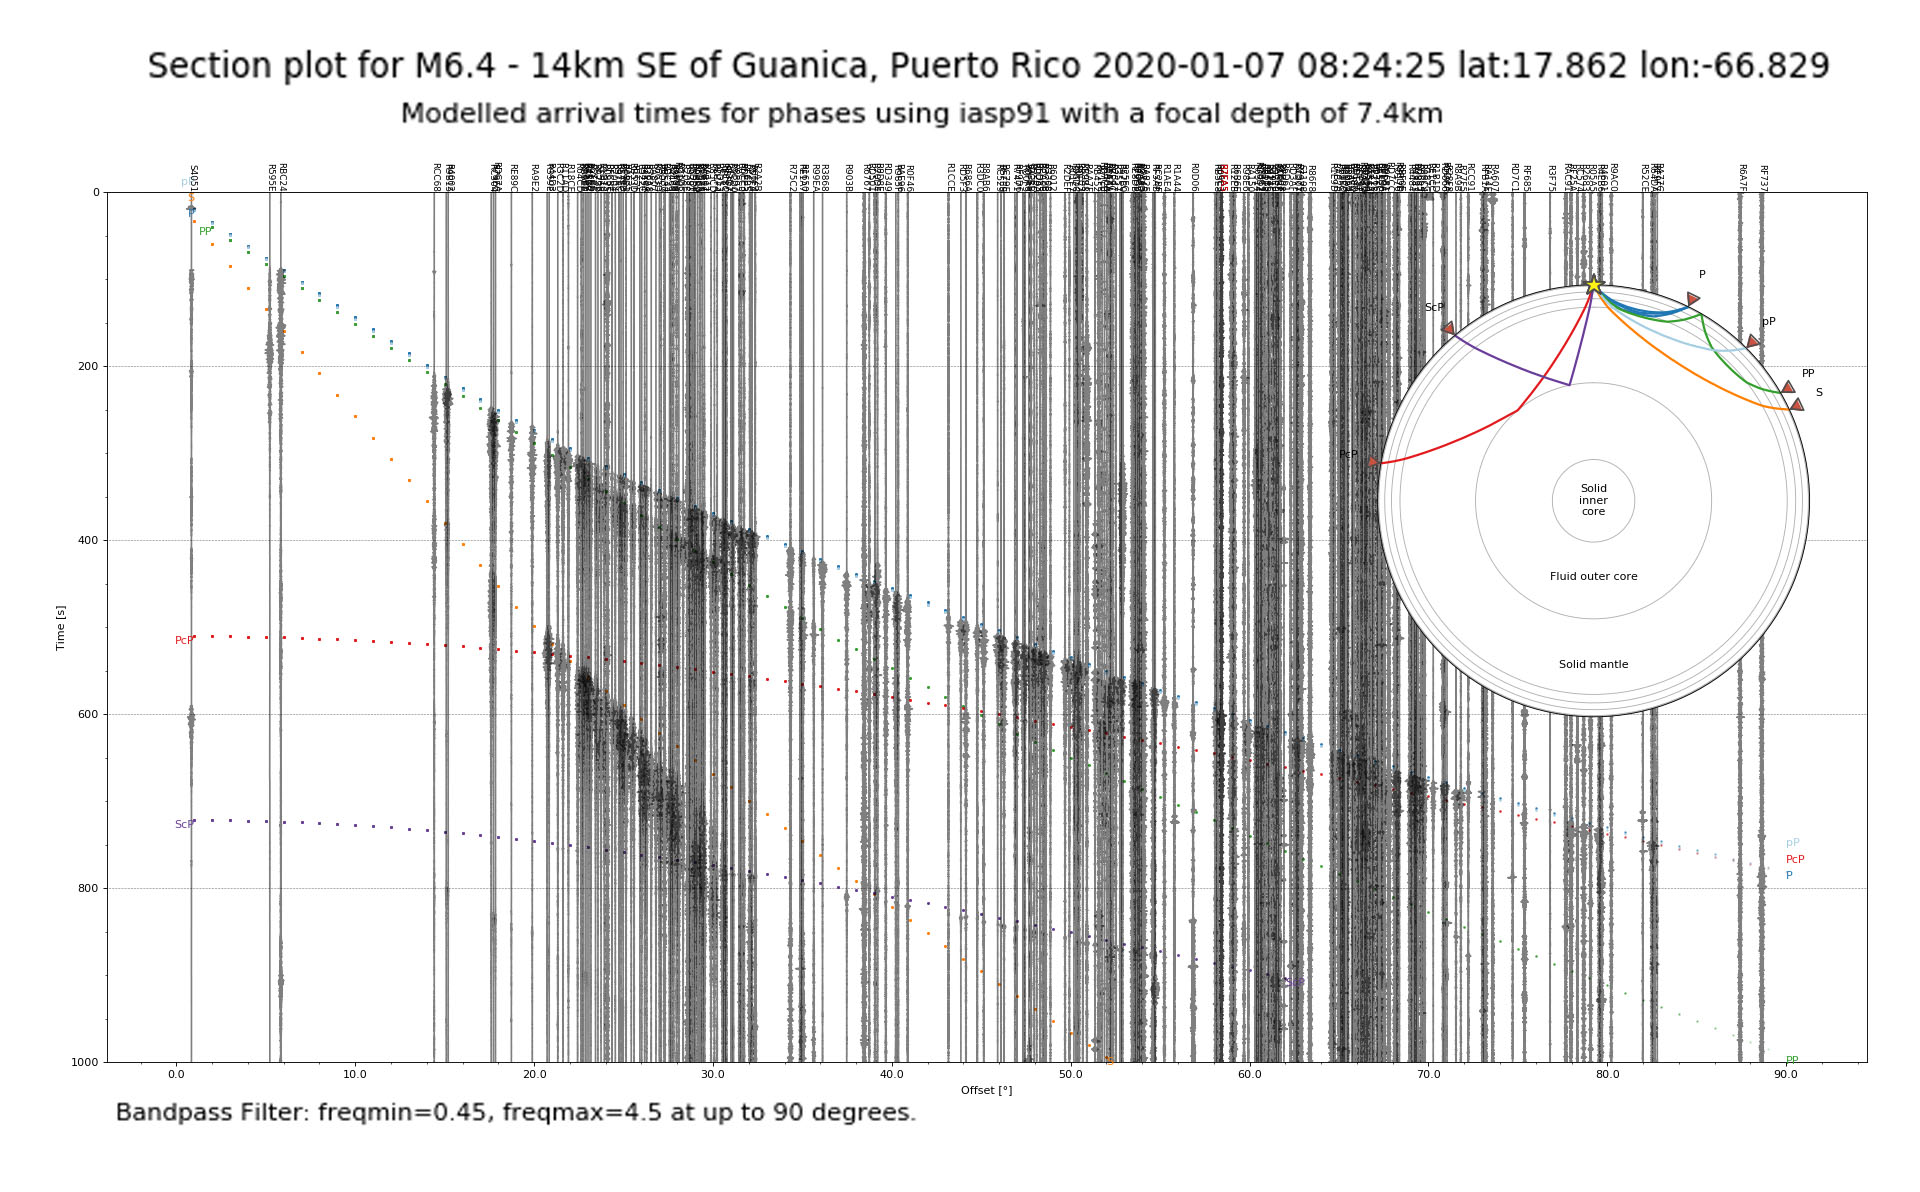
Figure 4: Responses to the M 6.4 earthquake in Puerto Rico on 7th January 2020, detected up to 10,000km from the earthquake.
The most obvious features on Figure 4 are the p-wave (primary wave) arrivals. The gradual curve in the p-wave arrivals is because these waves get faster as they travel deeper into Earth on their journey to more distant locations.
S-waves (secondary waves) travel at approximately half the speed of p-waves, so they take longer to arrive at their destination. S-waves also lose their energy more quickly than p-waves, so they become less distinct, even at relatively short distances from the source of the earthquake.
There are other phases visible on this plot, arrivals that I would normally ignore on a personal seismometer or write off as noise.
pP arrivals are from p-waves (p) that travelled towards the surface from the focus, to be reflected at the surface before travelling to the receiver. Because the source of this earthquake is only 7.4 km below the surface, the P and pP arrival times are very close to one another.
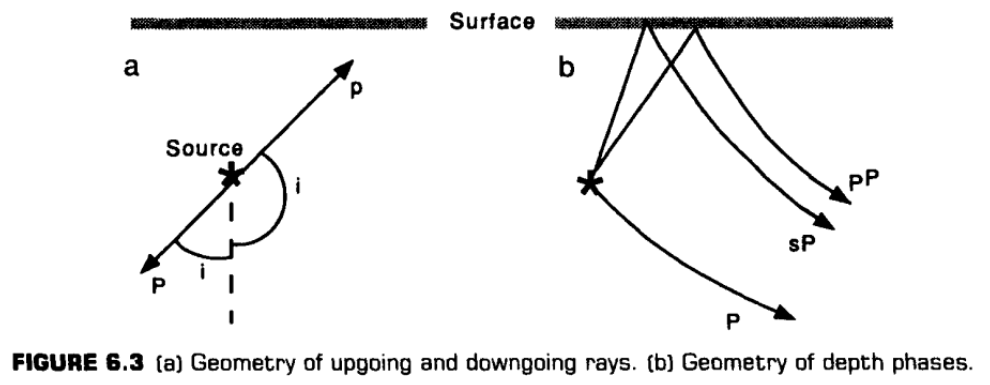
Figure 5: (a) Geometry of up-going and down-going rays. (b) Geometry of depth phases. From Lay & Wallace 1995 Fig 6.3.
PP arrivals are from p-waves that have started by travelling downwards into the planet, but have been refracted, arriving at the surface to be reflected there.
If you look carefully, you can also see the most amazing feature of this plot, which is the ScP phase, a reflection from the core. It is relatively unusual for this to appear so clearly. The ScP phase is created by s-waves (S) that have traveled downwards to the core and been reflected at the core-mantle boundary (c) to return to the surface as p-waves (P). I find it incredible that the Raspberry Shake network can detect reflections from the core.
Figure 6 shows the arrival of P, PcP and ScP phases at station R0F46 in Colorado, while Figure 7 shows station R1CCE near Phoenix, Arizona. Understanding how these stations fit into the global picture means that we can identify the arrival at 08:38 in Phoenix as the ScP phase and not the S-wave arrival. There is also a hint that the PcP phase may be present earlier in both records, when there is an increase in the amplitude of the p-waves. The slight delay in arrival of the ScP phase in both plots, relative to the model, represents an average reduction of about 0.75% in the velocity of these seismic waves relative to the model. This is due to them traveling through the deep mantle to the core-mantle boundary and back.
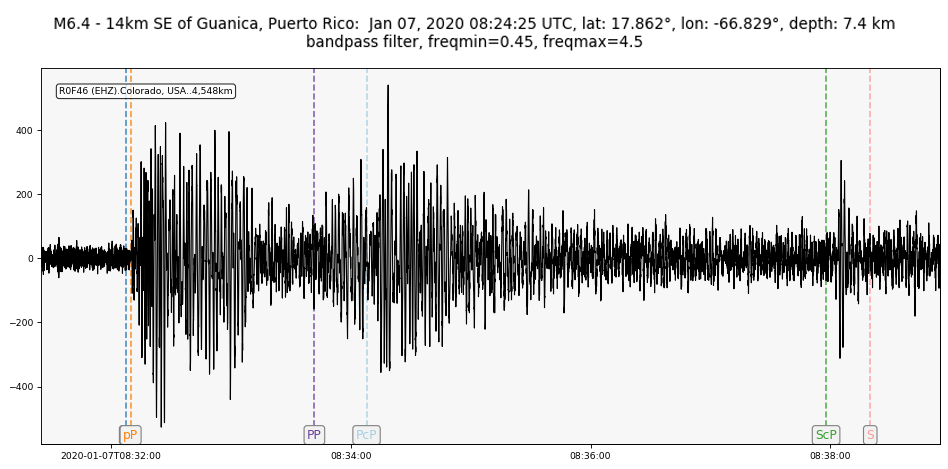
Figure 6: Responses in Colorado, to the M 6.4 earthquake in Puerto Rico on 7th January 2020.
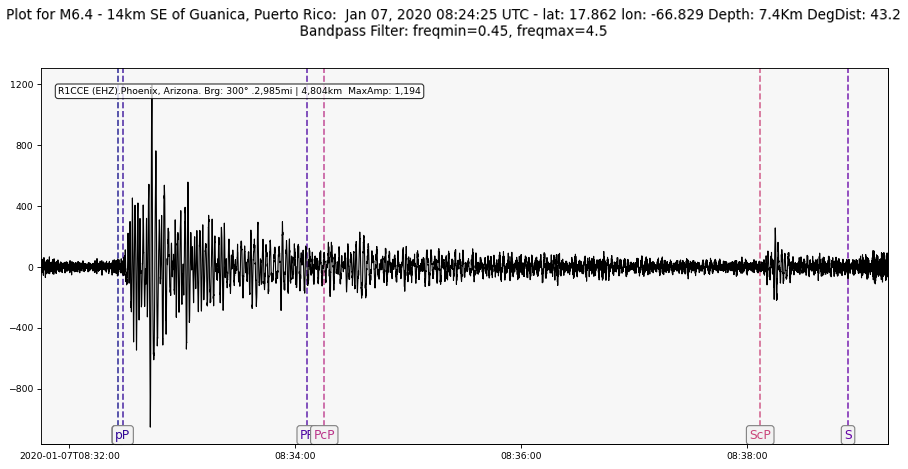
Figure 7: Responses in Phoenix, Arizona, to the M 6.4 earthquake in Puerto Rico on 7th January 2020.
THE CORE SHADOW ZONE 95-140°
Some earthquakes produce very clear responses at great distances. An example was the Magnitude 6.2 earthquake from Indonesia on 5th February 2020, shown in Figure 8. The rupture that caused this earthquake occurred at a very great depth, 592.4 km beneath the surface, in a subducted plate. If you compare Figure 2 from the Kuril’sk Islands to Figure 8 from Indonesia, the Indonesian plot gives a lot more detail from 95° to 172°, with greater clarity, even though it was a smaller earthquake. This clarity is because the source of the earthquake was very deep.

Figure 8: Responses to the M 6.2 earthquake in Indonesia on 5th February 2020, detected across the globe.
One interesting feature of Figure 8 is the core shadow zone, where direct, higher frequency p-waves and s-waves are not detected. Secondary school text books state that the core p-wave shadow zone extends from 104° to 140°, but this is actually only the case for surface sources. For deep sources, like the Indonesian earthquake, the shadow zone begins closer to the source of the earthquake, at 95° for the deepest earthquakes.
Despite its name, the core shadow zone does not lack seismic wave arrivals, but the phases received there are different to those received by closer seismometers.
- Direct s-waves are absent beyond the start of the shadow zone because they cannot pass through the liquid outer core.
- Direct p-waves are also absent from the start of the shadow zone to 140° because they are refracted by the liquid outer core, at the core-mantle boundary.
It is amazing that the liquid outer core and solid inner core both affect records from the Raspberry Shake network and that these effects can be seen clearly on the section plots.
HIGH ANGLE ARRIVALS 120°-180°
Figure 8 also shows some very clear arrivals at high angles. These phases have all originated from the same source and have travelled by different routes through the core.
- PKiKP is a p-wave (P) that has passed through the outer core (K) and reflected off the inner core (i) before returning to the surface.
- PKIKP is a p-wave (P) that has passed through the outer (K) and inner (I) core.
- PKP is a p-wave that has passed through the outer core (K).
- SKP arrived at the outer core as an s-wave (S), but was converted to a p-wave, before passing through the outer core (K) and arriving at the surface as a p-wave (P).
- SKiKP arrived at the core-mantle boundary as an s-wave (S), was converted to a p-wave, passing through the outer core (K), reflecting off the inner core (i) and arriving at the destination as a p-wave (P).
All of these phases are visible in Figure 8. So earthquake waves detected on Raspberry Shake seismometers like RD17E, in San German, Puerto Rico, have traveled from Indonesia, through Earth’s inner and outer core to reach a personal seismometer. This is then followed about 90 seconds later by a wave that has passed through the mantle and outer core, creating two responses on the seismogram in Figure 9. These responses are not two separate earthquakes, but instead they are waves which have traveled by two very different routes from the same earthquake source on a subducted oceanic plate in Indonesia, through the core, to Puerto Rico.

Figure 9: Responses to the M 6.2 earthquake in Indonesia on 5th February 2020, detected on seismometer RD17E in Puerto Rico.
CONCLUSION
I hope this article has communicated some of my fascination with seismic data from the Raspberry Shake network and that your Raspberry Shake data means a bit more to you when placed into a global context through the plots that I have presented here.
If you would like to learn how to process seismic data for yourself using Python 3, then you might want to take a look at the code in my GitHub repository. You can also get involved in the community of citizen scientists, teachers, university professors and professional researchers on Twitter.
THANKS
I am very thankful to the open source developers who have put their work online. Thonny, Python 3 and ObsPy are all free software from which I have benefitted massively, which is why I have also been trying to share my code and be helpful to others in response. I would encourage you to do the same.
One last thought. I would never have got started with this if my school had not been given a Raspberry Shake by United Downs Deep Geothermal Project (UDDGP), if I had not been put on a funded training course by them, or been continually encouraged by their interest in my progress. I am very grateful to have had their collaboration and would encourage other companies involved in Earth Science to consider getting involved in similar outreach to schools. The UDDGP have been exceptional in their outreach, not just in their school seismometer project. Their engagement with the local community, with schools and with universities could serve as a model for others to follow.
SOURCES OF DATA AND FURTHER INFORMATION
- The main data source for the traces is http://fdsnws.raspberryshakedata.com. I am very appreciative of the investment that Raspberry Shake have made to make all of the historic data from the network available through this service.
- The list of stations in the Raspberry Shake network comes from: http://www.fdsn.org/networks/detail/AM/
- You can see the worldwide shake network on a map view, here: https://stationview.raspberryshake.org
- My earthquake details generally come from the USGS earthquake search: https://earthquake.usgs.gov/earthquakes/search/. Just looking at recent earthquakes in the map view is very instructive.
- IRIS publishes interpreted plots for earthquakes, using professional seismometers, see http://ds.iris.edu/spud/eventplot for a fascinating set of plots for each major earthquake.
- If you want to try coding for yourself, the program for producing a section plot similar to the ones shown in this article can be downloaded from my GitHub repository here: https://github.com/wmvanstone/RPiShakeCode/blob/master/007-Kuril-section-model-lines-with-data-download-2020-Shakes.py
- The Thonny IDE, a beginner’s coding environment for Python 3, can be downloaded here: https://thonny.org/
- If you have not used the ObsPy library for seismic data processing, a good place to start is the tutorial: https://docs.obspy.org/tutorial/. I have published some sample code based on this tutorial, mainly focussed on the Raspberry Shake on GitHub: https://github.com/wmvanstone/LearnPythonForObspy with a description of the code on Blogger: https://carpebble.blogspot.com/2020/05/using-python-with-seismic-data-lesson-1.html.
At Raspberry Shake we would like to say a huge thank you to Mark for not only writing this article but also for inspiring others to do more with their Raspberry Shakes through the fascinating details he continues to share.