Data Dashboard Mashup to Display your Raspberry Shake Activity
February 10, 2022 – by Ben Orchard
ABOUT ME

Ben Orchard is a gadget geek that runs a global aircraft spotting website as a hobby after work hours and Tweets about tech and earthquakes on his Twitter channel @thebaldgeek. As an Aussie in Southern California, he has had to learn about what to do during and after an earthquake hoping that he never has to put that new knowledge to the test!
Earthquakes are fascinating, the notion that at some unpredictable time, something that seems solid and heavy (the very ground we walk on) can be shaken so hard that it moves like water… Amazing stuff!
Ever since hearing about earthquakes from a young age in school I have wondered what they would feel and look like? Growing up in Australia all the way to the age of 42, I never once felt the Earth move.
About 2 months after our family relocated to Southern California we were all just hanging out after dinner when suddenly a nice gentle sway back and forth got all our attention in that second floor rental apartment. My son, about 12 at the time, loved it. My daughter, 14 was indifferent, my wife was trying to be serious, but she saw the fascinated silly grin on my face and gave up pretty quick.
Thankfully it was nothing serious, but my little geek brain had to know… Where was it located? How strong was it, and oddly, what did it look like?
Raspberry Shake on Kickstarter
Not long after that earthquake, a co-worker introduced me to a website, kickstarter.com. After many successful and a few failed projects later, I was hooked. I had all the geek categories from the platform automatically email me the instant a new project was launched. This meant that it was a very simple mouse click for me to nab the first Raspberry Shake model within minutes of it launching (pretty sure I was in the first 20 sold).
Right from the get-go the Raspberry Shake team ran—hands down—the best project I have experienced on Kickstarter. Lots of open dialog, clear vision, single purpose and passion. Oh and delivering exactly what they promised on time sure helped.
I still recall the night I excitedly put the Raspberry Pi, digitizer and sensor in the laser etched plastic case.

My first Raspberry Shake just before powering it on for the first time – love the personal laser engraving
Booting it up and seeing it respond to every thump and movement on my desk was ecstatic joy. It is so sensitive, quickly I realized that you need something less shaky than a workbench to put my new sensor on. I moved it around the house for about a week and a half testing different locations. Anywhere upstairs was a no-go, just sneaking up and down the staircase was a mass of wiggles.

Perfect example of a noisy location
This screenshot is from the early days. You can clearly see the difference between then and now. Putting the seismograph in a vault or finding a noise free location is really important.
Most places upstairs or downstairs were out of the question as they were too “noisy” for my liking. The garage had cars coming and going and was too close to the street, and even on the back patio it was surprising to see how the Raspberry Shake could pick up things like nocturnal adult activities or the neighbors unbalanced washer/dryer cycle!

Quakes of all magnitudes are much clearer when the trace is calm
Your Shake Needs a Home – Sometimes in a Hole!
From the very start, the Raspberry Shake community has been one of its main assets. They are an enthusiastic and wide variety of folks from all over the world. The forum is a goldmine for all things shaking the citizen scientist world. There are lots of photos and passion about making a home for our Raspberry Shakes on there and on the website itself. Just take a quick look at the blog section on this website and you can find many options to build your own vault, so there is really no point in going into detail here to tell you how I made mine. My vault is in the backyard about 4 feet down and it looks and works great.

My Raspberry Shake is in its vault four feet below the fake rock
So this is not a blog post about my vault, this article is about visualizing the data from Raspberry Shakes. The Earth is constantly moving and I love being able to see it happen in near real time on a display in front of me.
Data Dashboards Within Easy Reach
I am all about data dashboards. I love seeing all sorts of live data that is meaningful to me on a central web dashboard and thus the old iPads I have scattered around my life have been put to good use! I find the live data from the Raspberry Shake incredibly interesting so here is how I went about making the data visible at the three main places I spend time; home, work and the computer room.
Node-RED is my web dashboard of choice, but I also have a custom one that works over the Internet to any device that has a browser. There are many free and subscription based options for web dashboards. It’s worth taking a look at the options and picking one if you don’t already have something running.
As you can clearly see, my display of choice is to use old broken iPads. They are cheap, a nice size and have lots of mounting options.

While not in use, my work iPad sits displaying my Shake dashboard which includes the two helicorder images
My Dashboard Overview
A quick bit of history about what we are looking at here…. Back in the day, seismographs were very physical, pen and paper were the norm. The usual setup was a rotating drum with a pen recording any seismic activity. After a few hours, the paper was taken off the drum and when laid out flat you had a plot of time vs activity.
The Raspberry Shake still uses this tried and proven method of displaying the vibrations, just without the ink. Every 12 hours (mid-day and midnight UTC) the page ‘rolls over’ and you start fresh on a new graph.
If you own any of the Raspberry Shake models you are probably well versed at looking at the DataView web app page and the 24 hour plots within rs.local/ that show the current and past helicorder pages (seismic signals recorded from your seismograph). Each page is a single image, just like a photograph. The live page is updated every minute or so. It’s this live or current page that I display on my dashboard.
Put simply, rather than logging into the Raspberry Shake on my network and selecting the latest helicorder graph, I have set up a system for moving that image to the iPad dashboard software.

My dashboard data is always close at hand, even in my computer room
As you can see from the iPad photographs, I have a ton of other data that is only meaningful to me, so please ignore it as it’s a bit of a jumbled mess, but it allows me to view it quickly and know what’s going on with the many systems I have set up.
That’s the power of a custom dashboard, I have fast, easily glanceable information at the places where I sit and do my work or hang out with the family.
The iPad looks a bit overwhelmed in this photo, but it works great in my computer room – and yes, as you can tell, I love vertical monitors, I have them at work and at home on either side of my primary horizontal monitor.
Node-RED has some nodes which can help bring in the Raspberry Shake raw data, but I really like the helicorder graph page view. At a glance I can see the weather in Australia (the trace is very noisy when the wind is blowing the surf into the cliffs of the Great Australian Bight) and the almost constant little earthquakes around California / Mexico and of course any large ones from around the world.
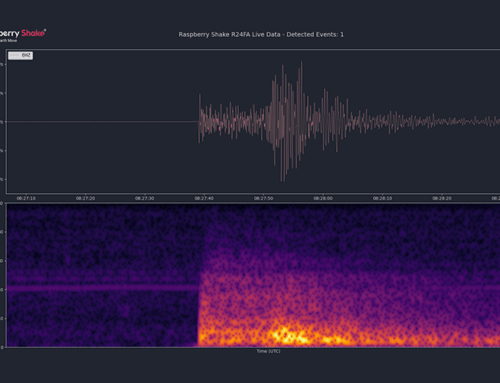
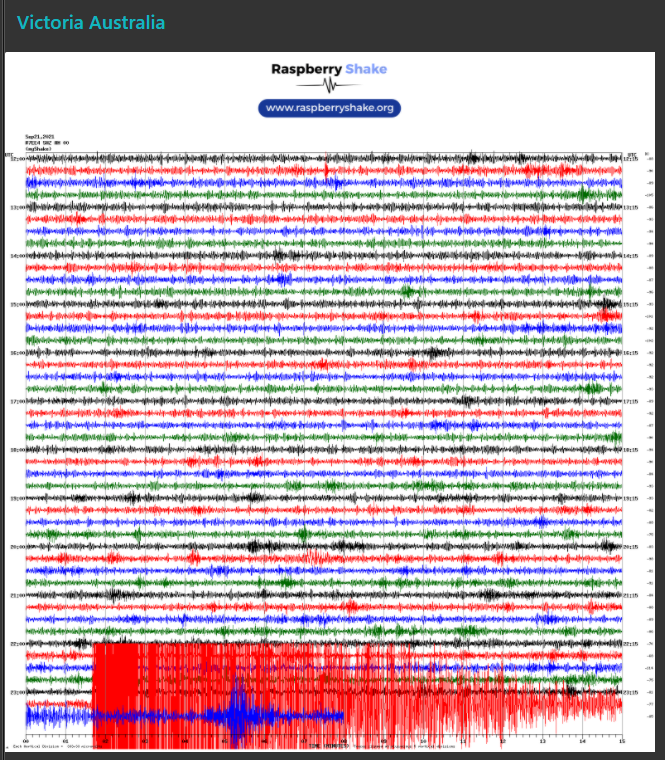
Here is a classic example, on September 21st 2021 the Earth moved for much of southeastern Australia, right where most of my family lives. They immediately looked at my dashboard URL and watched this M5.6 earthquake at Mt Buller unfold in ‘real’ time. With updates every minute they had plenty of time to watch and feel the earthquake roll under their feet.
Screenshot of the Node-RED dashboard showing 1 minute updated quake data
I have two Raspberry Shakes on my web dashboard. I loved my original so much, I backed the Kickstarter campaign for the 4D when it came out and sent my first one to my Dad in Australia since he loved looking at mine so much.
Like any programming task, there are a multitude of ways to get the same end result. I hope to explain the overall concept, to give you some ideas of how you might visualize earthquake data and achieve similar results.
Please note that the information I provide below is aimed at users with some basic programming skills. You do not need to be advanced but you do need to have the patience and mind set to use the command prompt inside the Raspberry Pi or have a friend with some Linux computer experience that is willing to help you out.
Making a Few Tweaks To Your Shake
The first thing I should mention is that this method will only work for Raspberry Shakes that you own. The Shake does not have to be on the same network as your dashboard (as is the case with my Australian located Shake – I have set up a VPN (Virtual Private Network) to access to it), but since you have to make changes to the Raspberry Pi, you do need to be able to access it’s operating system.
An overview of what I have setup
I have tweaked the software on the Raspberry Shake so that:
- Once a minute it finds the latest helicorder graph file name
- It copies (not moves!) that graph image to a new file – one with a constant name, and then
- It either accesses that image with the dashboard software, or copies it every minute to the dashboard software.
Exactly which method you take for step three will depend on your dashboard software and its location in respect to your Raspberry Shake.
Of course you don’t need to have ‘dashboard’ software to display things. You can also put the image up onto a webpage or blog, for example. Lots of people use tools like WordPress to build their own blog or personal webpage and you can have your Raspberry Shake helicorder graph image displayed there if you like.
My end goal was to simply have a more visible – auto refreshing – view of the current helicorder graph.
Rename Your Latest Helicorder
The first challenge I had to solve was the file naming of the helicorder graph images. They are date time stamped and so are always changing. I needed to get the latest image from all the ones in the history directory and rename it with a constant name, simply overwriting it each time I updated it. That way my web dashboard just has to get and display a single image with the same name every time.
Using a method called shell or ssh, I was able to remotely connect to the operating system on my Raspberry Pi.
Once there I used a cp or copy command:
This makes a copy of the result of the ‘ls’ or directory listing command sorted by the most recent files first. The latest file in this list is then copied into the same directory with the name “latest.gif”. This copy command leaves the original file untouched and intact.
To run this command over and over at a given frequency we use the “Linux crontab”. This is a simple time scheduler. How often you do it is up to you, but since the time marks on the helicorder graph are at one minute intervals I chose to do this once a minute. So my crontab looks like this:
Of course be sure to swap out the text “R2791_” with your station name. Also note that the file name after the station number is different between the original RS1D and RS4D.
What we are saying here with this command is that every minute, of every hour, of every day of the week, of every month, copy the latest helicorder graph to a file named “latest.gif”
With that done, we now have to get the image onto a web server that the dashboard can access.
Giving Your Dashboard Access to ‘latest.gif’
This step is a bit tricky to give specific steps for as there are many different web server options, some public, some private. Some dashboard software options run their own web servers for their users’ data. It just depends on what your end goal is and what path you would like to take.

Another screenshot of the Node-RED dashboard that family and friends check on
In my case, Node-RED has a web interface and so I copy my ‘latest.gif’ image into the computer running Node-RED and then I can put the image on my dashboard.
To do this I run another cron job every minute that does a secure copy or scp from the Raspberry Shake to another computer on my local network. So yes, once a minute the Raspberry Shake in my backyard copies its file over my local network and the same with my Dad’s Shake in Australia, sending his copy over the Internet.

Even when I am chilling on the couch, my data dashboards are close at hand.
Once that image has a URL or web location, I just point my dashboard software to get that image and display it. It’s a lot like having an image of a webcam or a weather station that you want to update to keep an eye on things. You should not put the Raspberry Shake on the Internet, just like you should not put the webcam ‘on’ the internet but rather send the image over the Internet.
Need Some Help?
If you need to ‘phone a friend’ and get some help with this step from someone you know who understands this sort of thing, here is a suggestion to help smooth the process.
If you just ask them how you can display your “helicorder”, you might get some funny looks and spend a lot of time talking about the helicorder itself rather than getting to the task at hand… So what I have found works well is if you simply tell them that you have an image on a Raspberry Pi that you would like to display and update every minute. This is an extremely common requirement of many websites and one that has many solutions to. In other words, it’s a task that has already been solved, no need to reinvent the wheel here.
The genius thing that the Raspberry Shake folks did is base their seismograph on a Raspberry Pi computer, something that you can access and slightly tweak to add features like this. This foundation can’t be overstated. Having an open and accessible platform is a huge boost for any product.
I hope that I have inspired you to view your data in different ways. I’m told by my family who are scattered around the world, that they check into the dashboard I created at least twice a day to see what’s shaking. And best of all I have almost around the clock visibility to the minute of any earthquakes, just as they happen. I have had this dashboard setup running trouble free for around four years and I have never tired of watching all the little wiggles!
By the way, if you are wondering about the quake on the displays, it was the M7.3 in Timor on Dec 29th 2021.