RSUDP 2.0 is here!
Raspberry Shake’s RSUDP is an innovative open-source software designed to transform how we monitor and visualize seismic data.
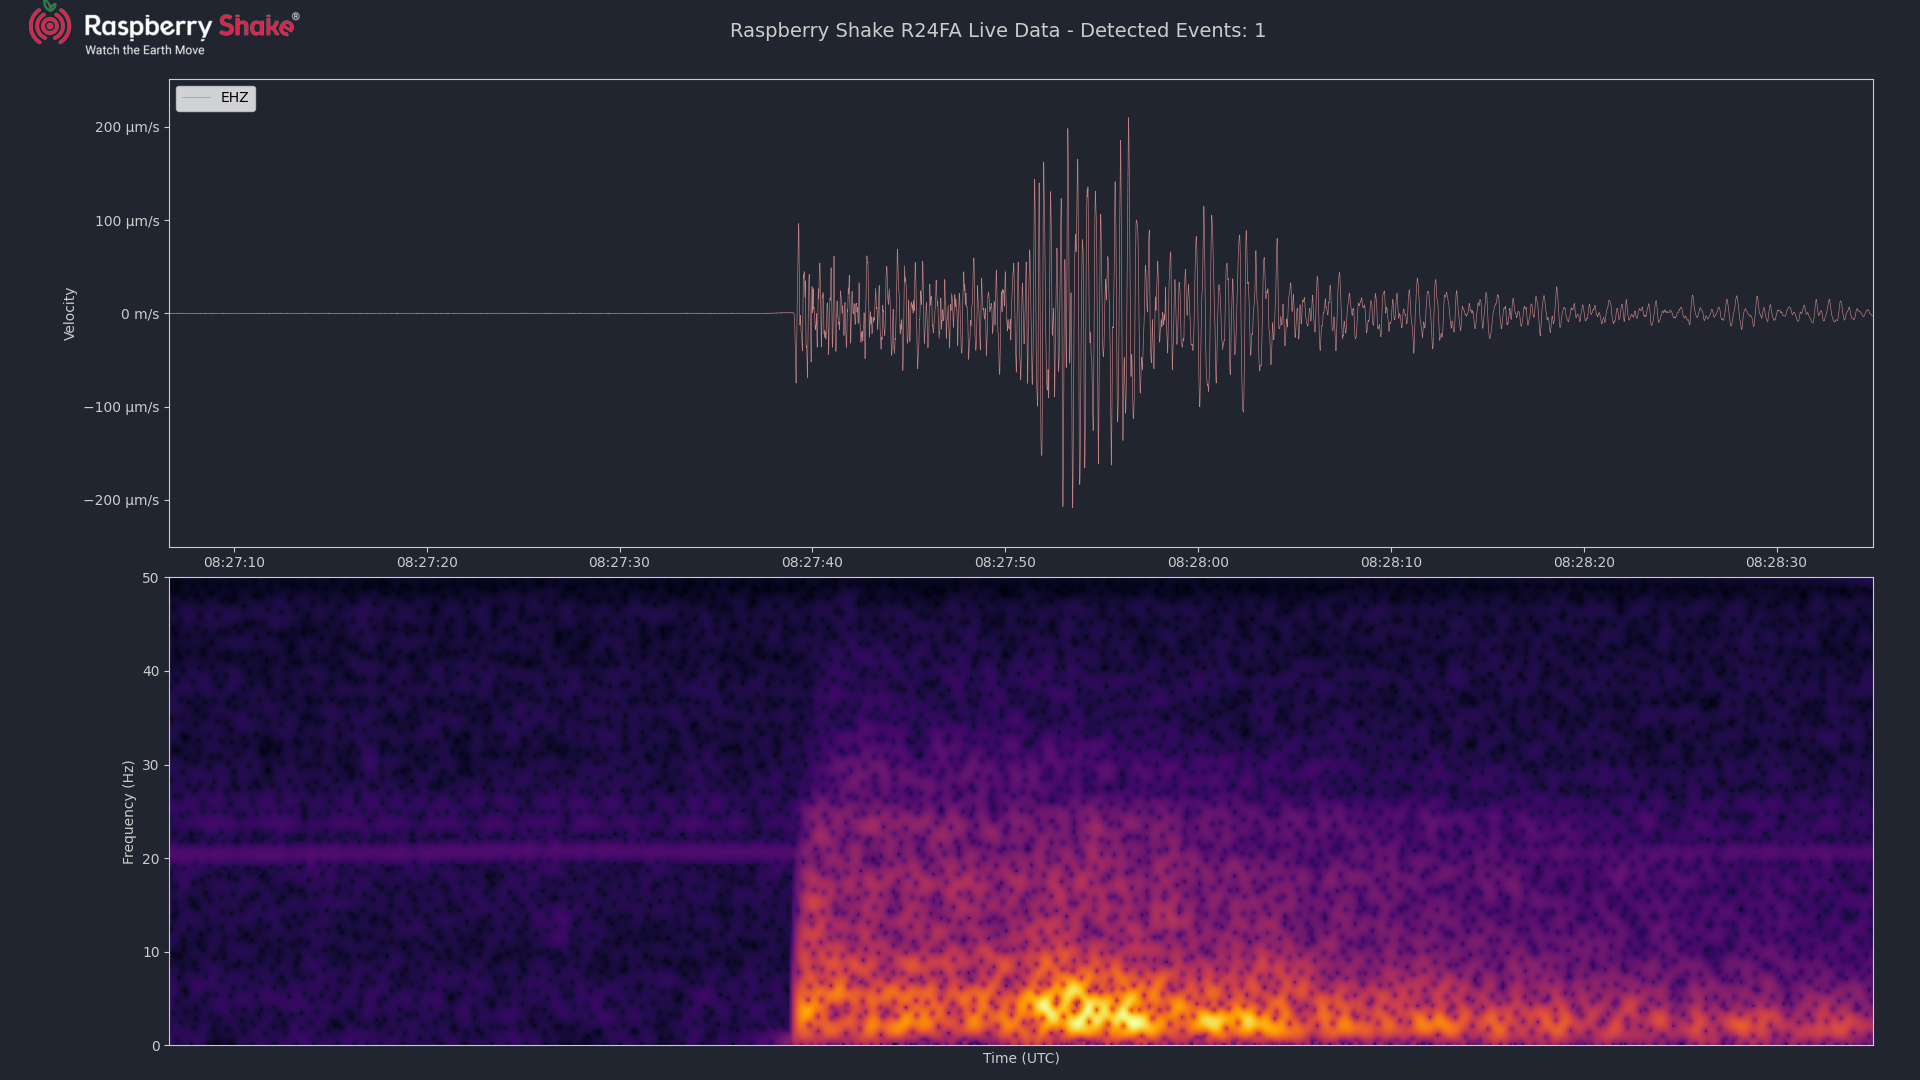
The original development
Developed for the Raspberry Shake community, RSUDP seamlessly interfaces with all Raspberry Shake models to process and plot real-time seismic data. Whether you’re a seismology enthusiast, an educator, or a researcher, RSUDP offers a versatile set of tools in Python for continuous monitoring, notification, and at-a-glance informative visualizations of the Earth’s movements. Thanks to its flexibility, user-friendly GUI, and broad platform compatibility, RSUDP’s overall suite of functionality makes it highly effective for display kiosks, automated alert systems and more.
What sets RSUDP apart is the balance which has been achieved between simplicity and advanced functionality. Designed to operate efficiently on devices as small as a Raspberry Pi, as well as on standard PCs and laptops, RSUDP lets users explore detailed real-time seismic processing absent an overwhelming learning curve.
Its visually engaging plotting routines excel as an educational gateway to the science of seismology, as well as showcasing all those vibrations going on around the Shake – from distant earthquakes to local tremors. By prioritizing simplicity, stability, and adaptability, RSUDP offers top-notch seismic monitoring to a wider range of users than ever before, making it a significant asset in the seismological community.
The updated v2.0
The release of RSUDP v2.0 marks a major development milestone, bringing the software in line with the latest advancements in Python. Previously supporting Python versions 3.7 and earlier, RSUDP now handles Python versions 3.10 through 3.12.
More than just a version update, this latest release is a deep redesign aimed at future-proofing RSUDP to the greatest extent possible. Utilizing the latest versions of Python, the dev team has improved performance, expanded functionality, and ensured that RSUDP remains a reliable and feature-rich tool for real-time seismic monitoring and more.
With these changes, users will confidently adopt the latest software features while continuing to explore Earth’s vibrations within an extensive community-driven platform.
With that, let’s dive into some of the new features of RSUDP v2.0!
New features showcase
All new features are accessible/editable via the JSON configuration setting file, as usual. For a refresher, don’t forget to check the dedicated RSUDP manual!
Plot Refresh Rate
One of the key updates in RSUDP is the introduction of a refresh rate parameter for the plotting module.
Users, especially those running RSUDP on lower-spec systems like older Raspberry Pis, previously reported that the continuous high-speed refresh rate could place heavy demands on CPU resources.
Now, users can define a refresh interval in the configuration settings file, reducing the frequency of plot updates. For example, setting a refresh rate of 5 seconds significantly decreases CPU usage while maintaining the functionality of a real-time monitoring asset.
This enhancement allows RSUDP to run on more types of hardware configurations, making it now available to a broader audience.
Trace Filtering
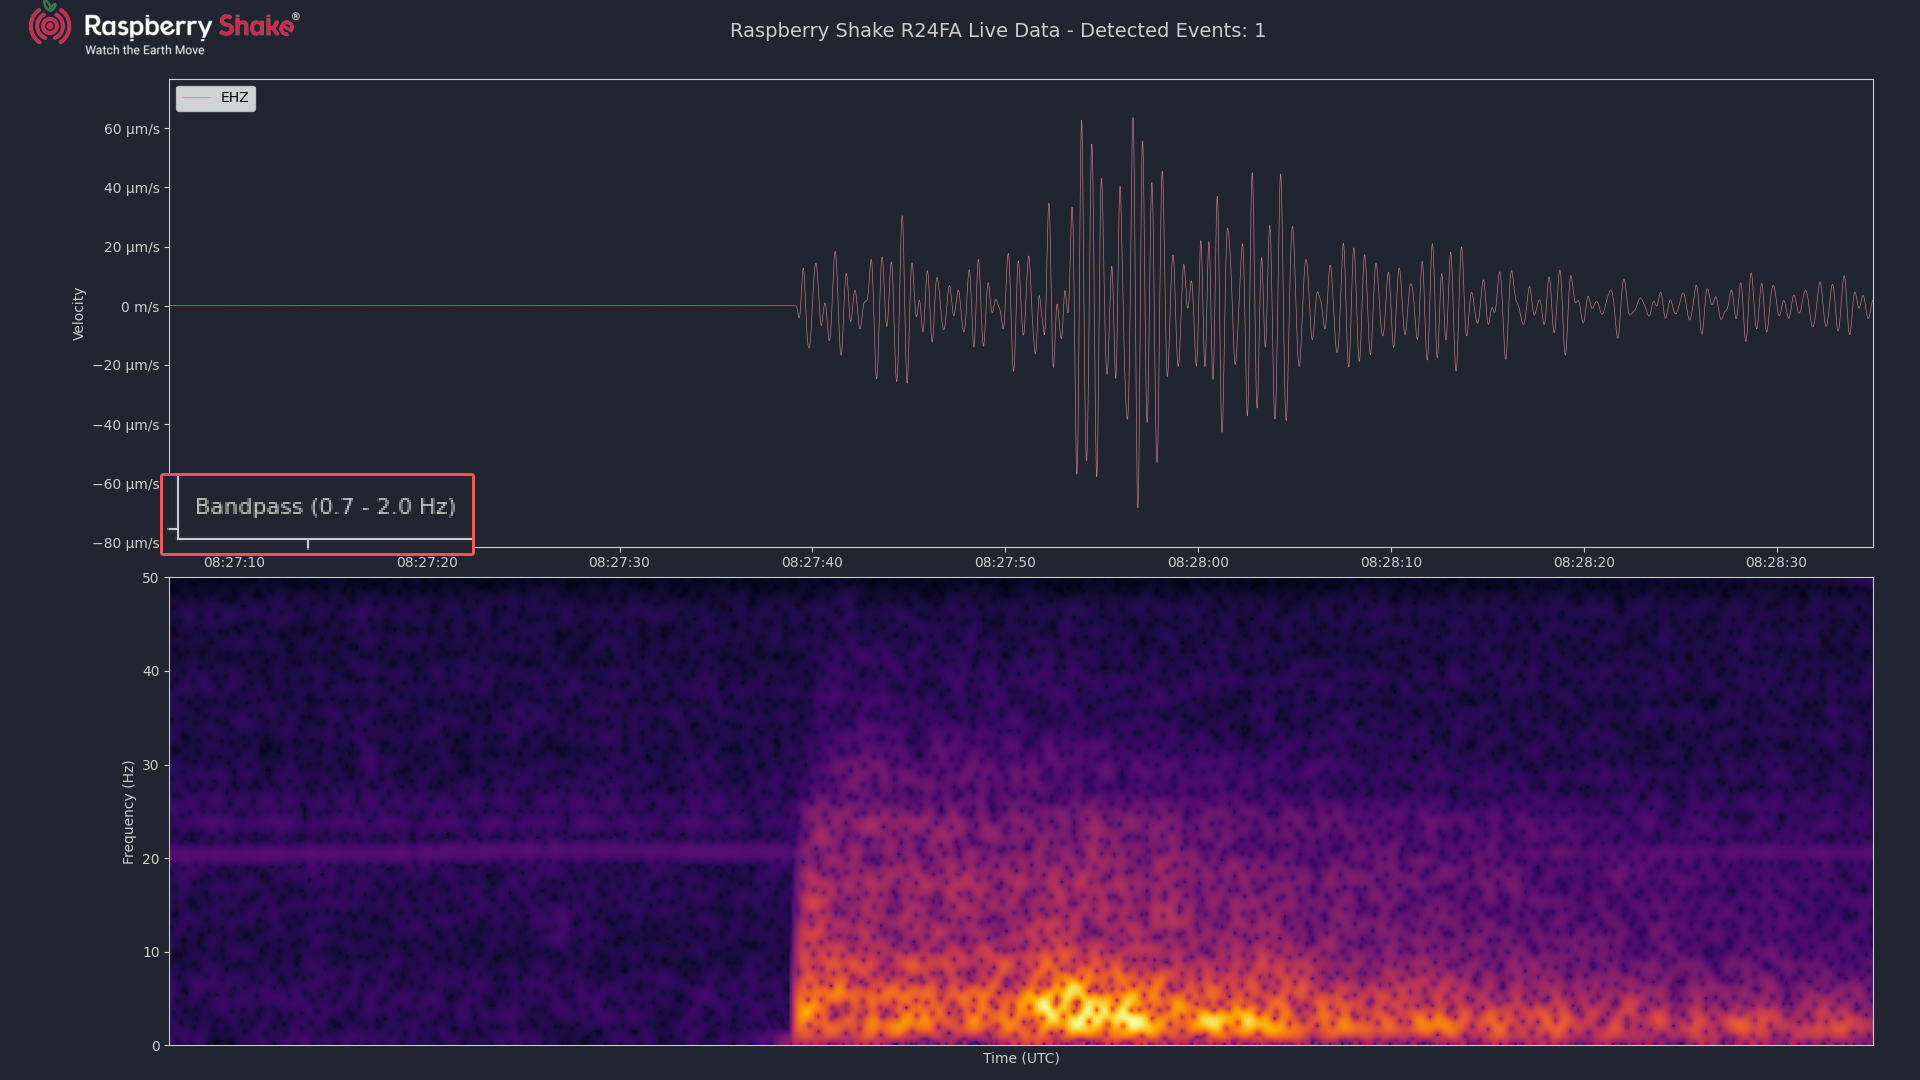
RSUDP v2.0 now includes the highly anticipated and requested feature of trace filtering, enabling users to pass the incoming raw live data through a common ObsPy bandpass filter.
This new feature allows filtering to be customized in order to highlight a frequency range of interest, hugely expanding the visualization possibilities in this software. Trace filtering not only improves data clarity by focusing on a desired data range but also enhances RSUDP’s versatility as both a monitoring and educational tool, giving users more control over how seismic activity can be interpreted in real-time.
Special thanks to Steve Caron for his invaluable help in the development of this functionality and for getting things up-and-running as quickly as possible.
Spectrogram filtering
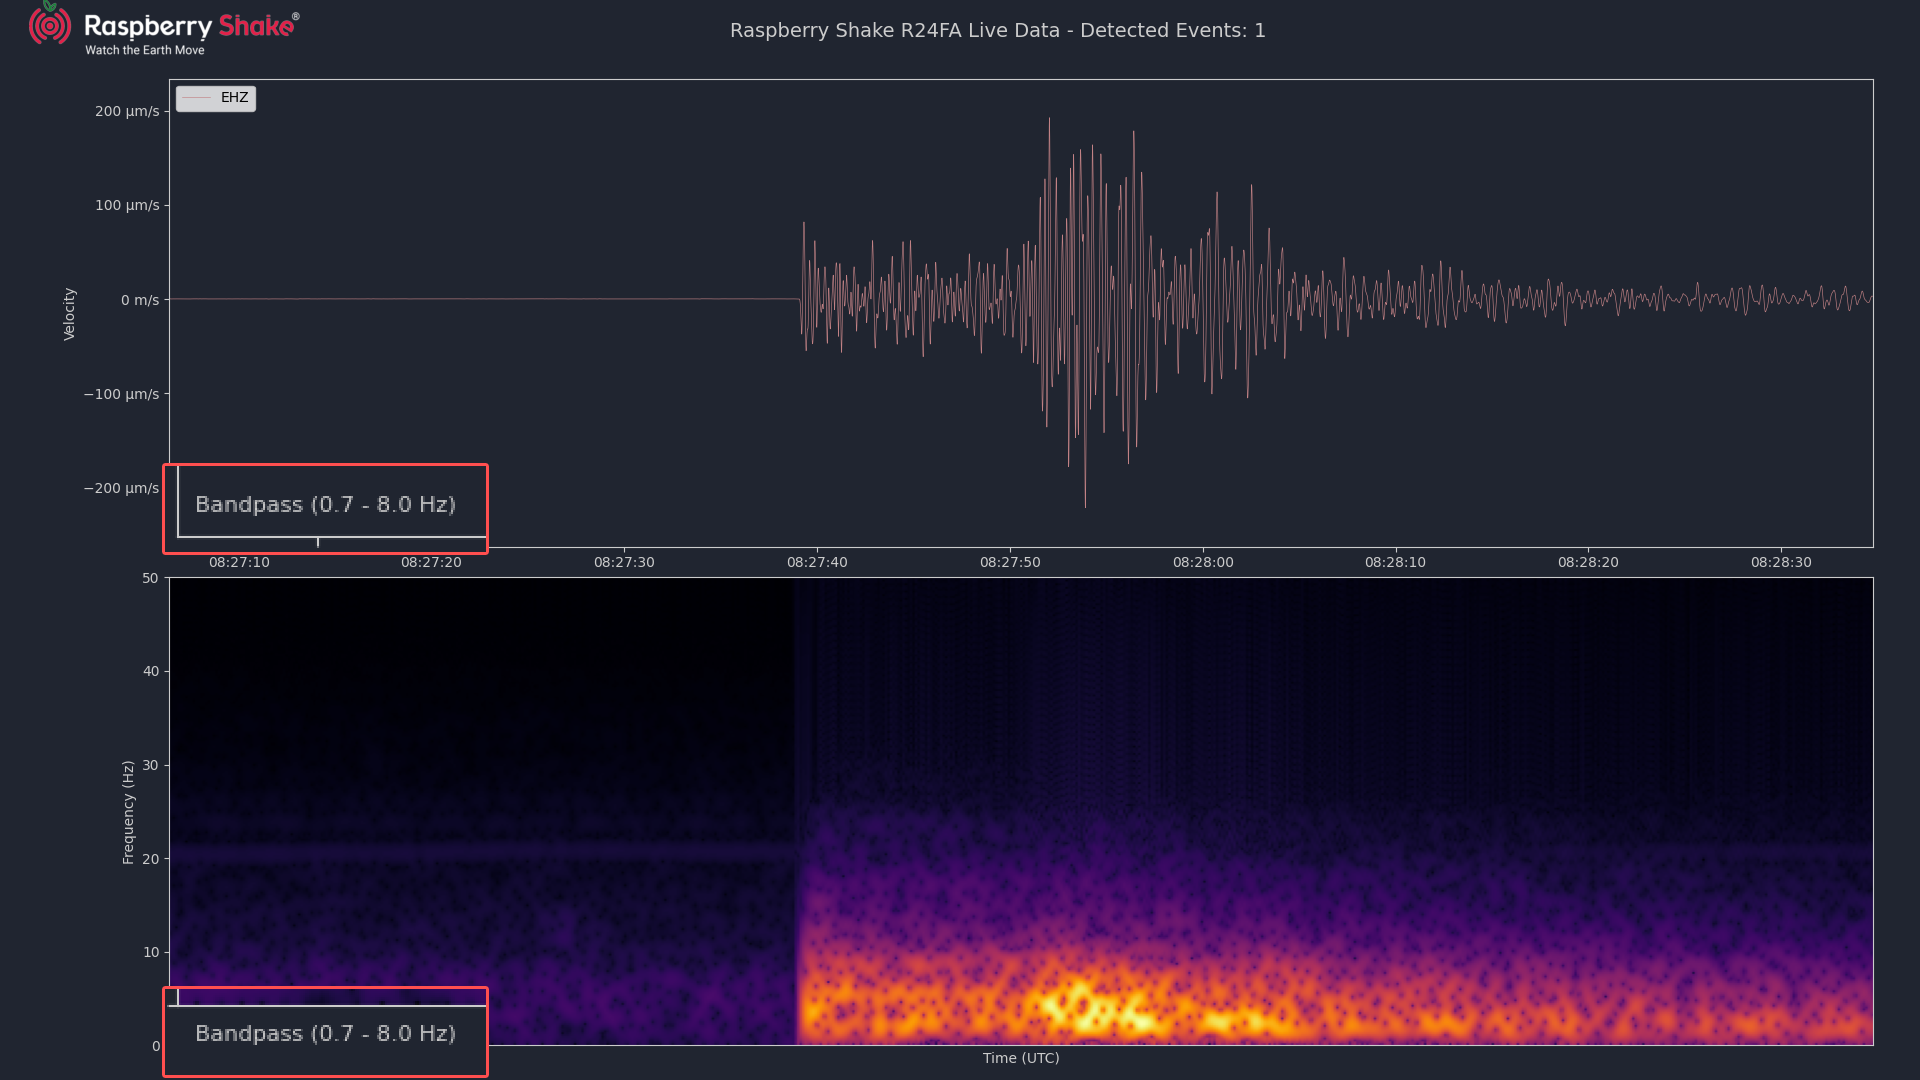
Building on the trace filtering functionality above, RSUDP v2.0 now allows users to apply the same filtering principles to spectrograms.
In this way, users have the possibility to enhance or suppress specific frequencies to further customize their spectrogram display, offering a more refined visualization experience.
Whether users are looking for low-frequency teleseismic signals or high-frequency local events, spectrogram filtering ensures that the on-display data aligns with their observation and research objectives.
Spectrogram range display
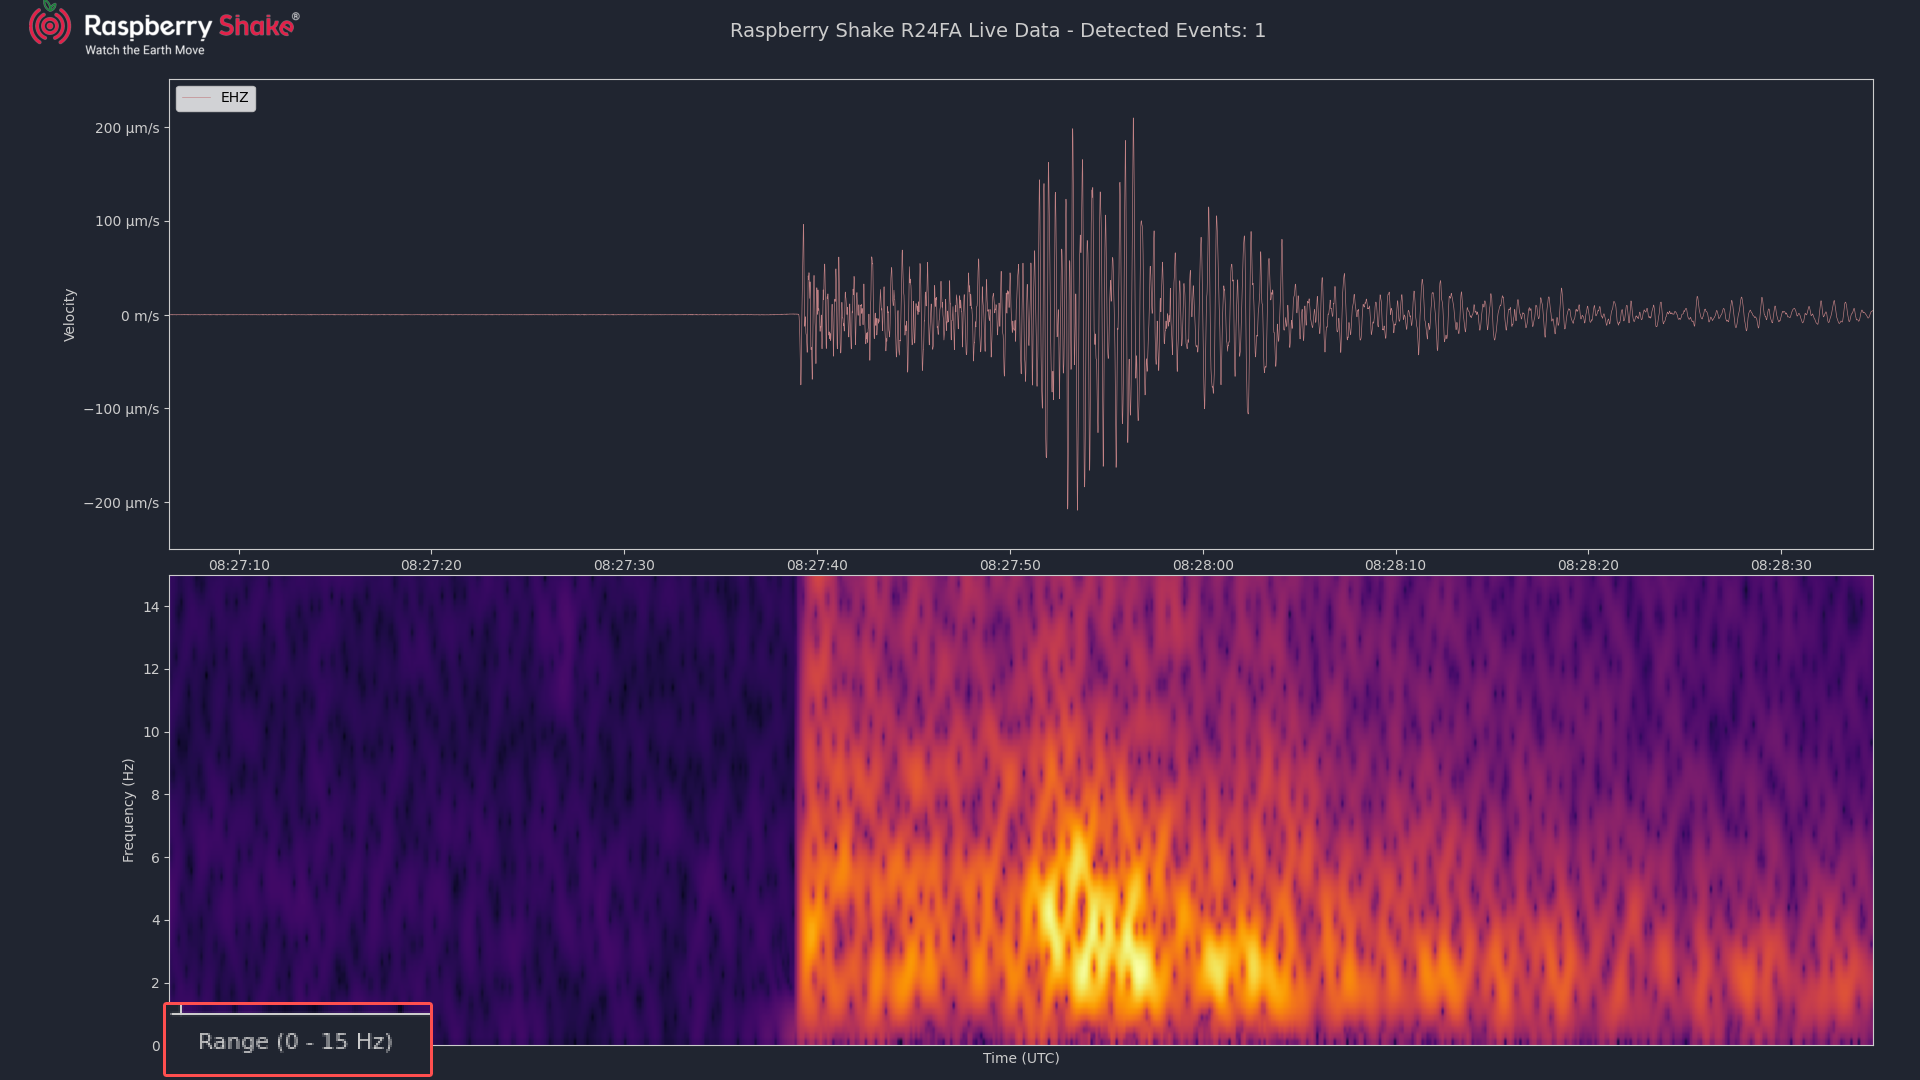
Another user-requested feature provided in RSUDP v2.0 is the ability to customize the frequency range in the spectrogram display.
Previously, the y-axis frequency range was fixed to display all resolvable frequencies for 100 Hz data, that is, between 0 and 50 Hz. The spectrogram’s window frequency range interval can now be defined to display only a range of specific interest, such as 0–30 Hz, 15–45 Hz, etc.
This additional customization makes the spectrogram display more relevant for specific applications, whether filtering out higher-frequency noise or zooming in on low-frequency seismic events. More and more, this gives the user increased flexibility in customizing their analysis versus their specific needs.
Logarithmic Spectrogram Y-axis
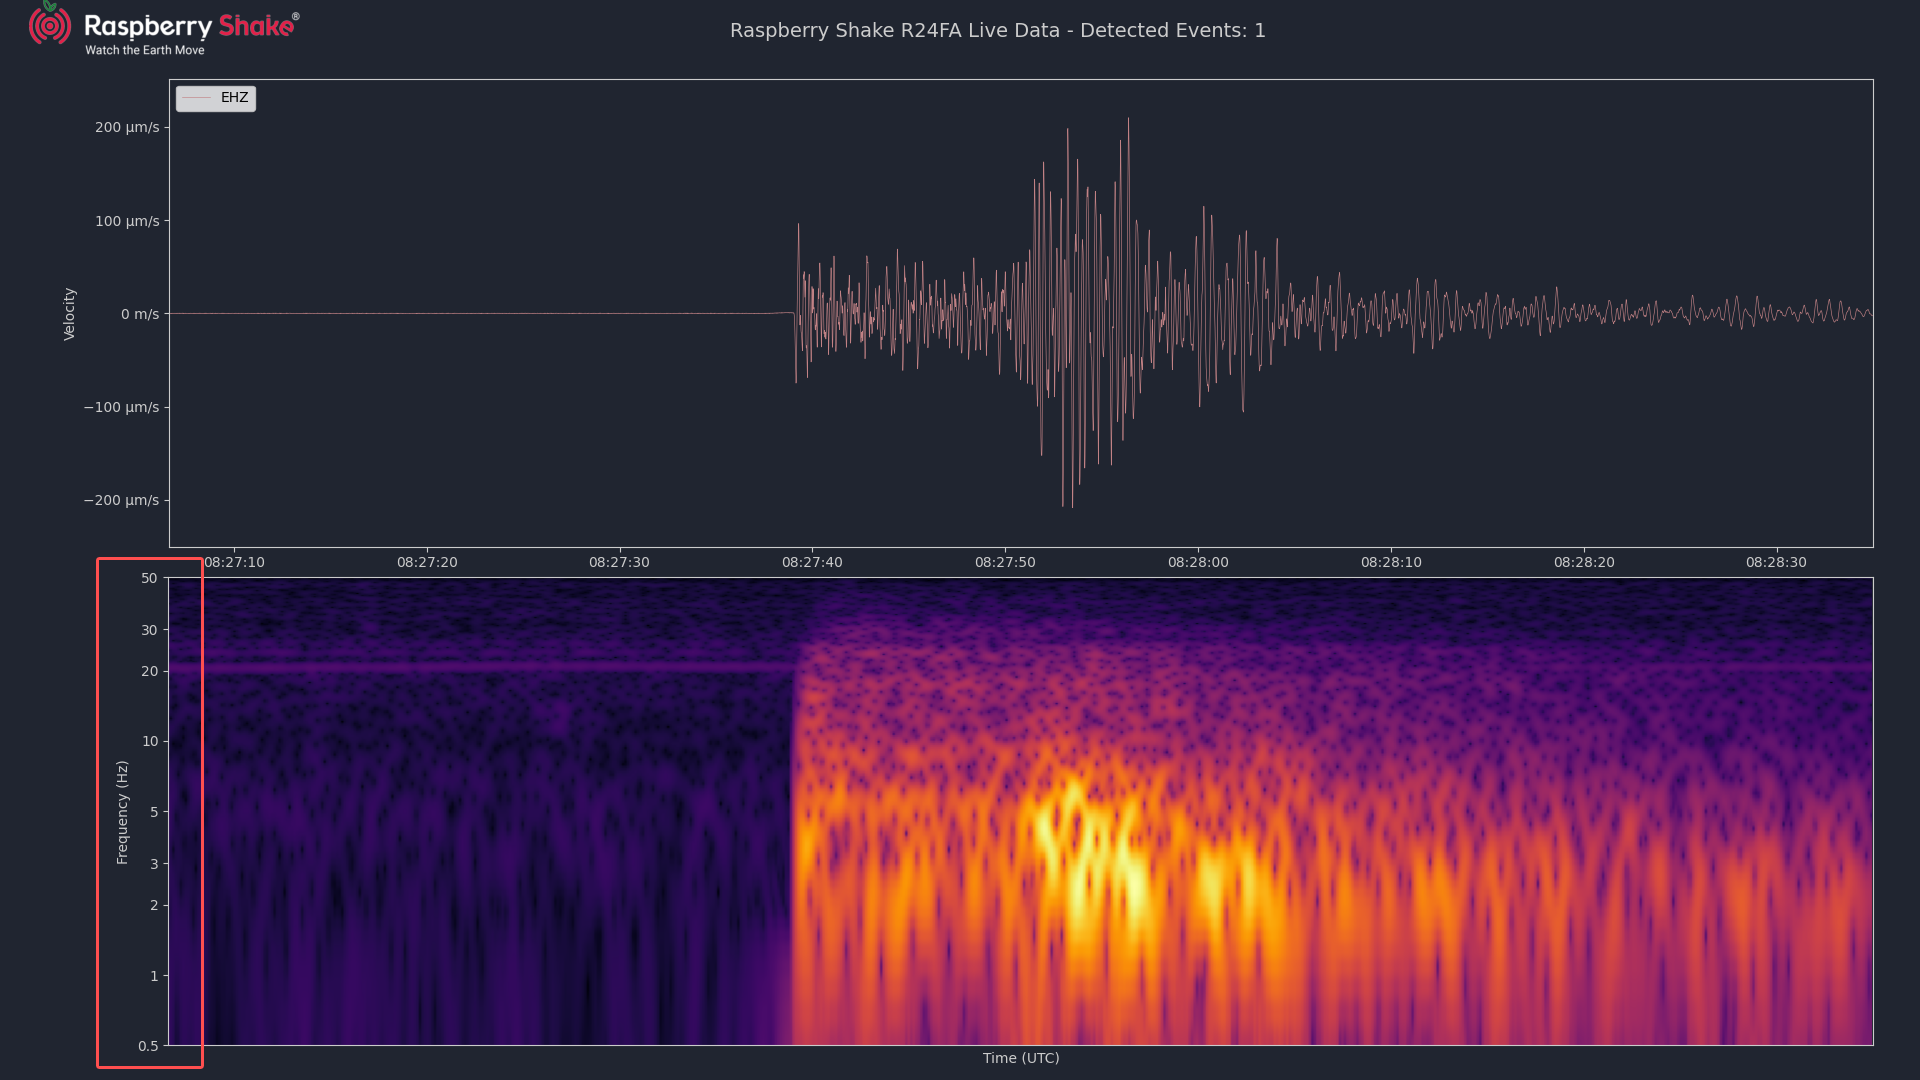
To bring RSUDP’s plotting tools in line with professional-grade seismic monitoring systems, the spectrogram display now includes a logarithmic option for the y-axis display.
Particularly useful for analyzing faint, distant teleseismic earthquakes, this enhancement amplifies the visibility of lower frequencies without compromising data accuracy. This now mirrors how this is done in the Mobile App.
By providing a clearer representation of seismic activity across a wider dynamic range, the logarithmic y-axis improves both the educational and practical applications of RSUDP.
Improved Timing Alarm
The timing alarm system has received a significant upgrade, addressing a common issue where short-lived disturbances could trigger false alarms.
Instead of relying solely on a single threshold value, the new system incorporates a configurable timer, allowing users to specify a time duration that must also be met for an alert to be triggered. This will have the effect of reducing false positives, while improving the sensitivity in identifying longer-lasting events.
For example, this will ensure that an alarm is triggered only if the configured threshold is exceeded for a minimum of 10 seconds, thus filtering out short, non-seismic disturbances.
A possible use case for this could be:
- Starting a timer when an anomaly (signal exceeding a threshold) is detected.
- Confirming the anomaly persists for a sufficient time before declaring it a valid trigger.
- Cancelling the trigger if the anomaly dissipates more quickly than expected
- Providing feedback (via print statements) about the timer and trigger state for debugging or logging, essential for fine-tuning.
STA/LTA Triggers
Users can now choose how to visualize seismic STA/LTA triggers directly on the plot, with flexible options defined in the configuration file. These include disabling the overlay, displaying it in a separate window, or integrating it within the main plot. Other visual customization options are also available, such as setting unique colors for the start and end trigger lines.
This was made possible by overhauling the previous plotting system, with the current controller now managing multiple plot windows/instances. Additionally, trigger-dedicated modules have been rewritten to allow the display of STA/LTA references on RSUDP plot windows in a more efficient way.
All the changes not only improve the modularity and maintainability of the codebase but also lay the groundwork for future scalability. Unlike the previous implementation, where plotting occurred in a standalone thread, RSUDP now avoids threading conflicts with matplotlib by keeping all rendering within the main process. This ensures more stable performance and fewer graphical glitches, particularly on systems with limited resources.
Want to explore more about RSUDP?
Check the RSUDP Manual here.
Visit the RSUDP GitHub repository here.
Get in touch with the Raspberry Shake Community here.
Join the Raspberry Shake Discord Server here.
Conclusions
RSUDP v2.0 is an essential update to the original software core, delivering yet more features and improved overall performance.
With the introduction of innovative features, such as custom refresh rates, advanced trace and spectrogram filtering, user-defined frequency ranges, STA/LTA triggers, and many more, as well as bringing Python version compatibility in line with the latest available, the system is now more efficient, more accessible, and more reliable than ever.
With these updates, RSUDP continues delivering on its mandate to empower a growing community of seismic enthusiasts and researchers, thus ensuring its long-term adaptability, reliability, and overall universal adoption.
– Giuseppe Petricca