USING SHAKE DATA FOR YOUR WEBSITE, MOBILE ALERTS, AND LIVE STREAMING!
12 November, 2019 – Written by Steve Caron
WHAT CAN YOU DO WITH YOUR RASPBERRY SHAKE DATA?
In my previous article I described how I built my seismic vault that houses my RS4D. Now that I have a good location for my Raspberry Shake, I wanted to find out what I could do with the information the Shake was generating. It took a little while to get where I am now. I learned a lot from others in the Shake community. As they shared their experiences, I slowly applied what I learned.
This article is not intended to be a step by step how to guide. I will give a high-level view of what I did to show what is possible using the Raspberry Shake’s data. I am sure there are many ways to achieve what I have done and what I did may not be the best or only way. The information in the article will hopefully provide you with the building blocks to begin using Raspberry Shake data to meet your needs.
MY “PRE-RS” EARTH MONITORING WEBSITE
My www.chinohillsweather.com website has been up and running since 2005. The website is a place for me to display the weather data collected from my backyard weather station. Over time, I have added non-weather information. One of the early additions was the local earthquake page. The page displays earthquakes 2.0 or greater within 200 miles of Chino Hills, Ca for the past 7 days. The earthquake data for this page comes from the USGS.

The template I used for the page can be found here. The author of the page has made it easy to configure. I have only made one modification to the template. I added the distance and direction of each quake from Chino Hills. If you do not have a Raspberry Shake, this is a great way to view and share earthquake information in your area.
ADDING RASPBERRY SHAKE DATA
The main reason for adding the Shake data to my website was to give me the ability to view my Raspberry Shake information remotely. Of course, this also makes the data available to anyone who may be interested.
The First Step
To start incorporating Raspberry Shake data onto the website, my first thought was to upload a helicorder image. I experimented with uploading the helicorder images that the Shake produces. However, the helicorder images produced by the Shake could not be filtered by frequency. Without filtering, local cultural noise causes smaller local and larger distance quakes to become difficult to view.
I began looking at the other software options listed on the Raspberry Shake Online Manual and I also searched to see what other options may be available that could produce a frequency filtered helicorder image. I ended up using WinSDR.
WinSDR has many features including the ability to monitor and view frequency filtered versions of Shake channels. A helicorder image can then be created from this filtered channel. So, I created a virtual channel using my RS4D’s EHZ channel. The filter I use is 0.3 to 3 Hz. I do not have any great reasoning for the frequency range other than it works well to display both small local and large distance earthquakes for my set up and conditions.

I now had the ability to create a filtered helicorder image. The next step was to get it uploaded. WinSDR creates the helicorder image every 5 minutes. I use WinSCP to monitor the directory the helicorder file is created in. When an update is detected, the file is FTP’d* to my website (You can also use WinSDR’s built in FTP to perform the upload). *FTP = File Transfer Protocol
The webpage was not fancy at first. It only consisted of one helicorder image, but I had done what I set out to do. I could view a frequency filtered helicorder from anywhere and any one else interested could do the same.
In fact, someone did take an interest in the helicorder page. Not long after getting the helicorder image up and running, I received an email from a fellow shaker Tony (RAA90) who lives in Tasmania. He liked my helicorder image and wondered how I did it. I described what I did and I helped him get winSDR running. After a few emails and a couple of technical challenges, his page was up and running. Then over the next couple of months we exchanged emails and ideas as we both refined and updated our helicorder pages.
One day I went to view his helicorder page and I saw spectrum and waveform images displayed. I had to know… how did he do this? This was such a nice addition. He pointed me to this entry in the Raspberry Shake’s google group. A contributor had written a javascript application (swarmPlotter) that would generate a waveform, spectrogram, or helicorder image using swarm. The script is executed via the command line. I experimented with the options and eventually selected the time interval and images that I have on my site today.

Once I was happy with the images being produced. I needed to get them up to the helicorder pages. This is done using a combination of Windows scheduled jobs and WinSCP.
The window schedule job runs the command line creating the image. The images are then auto FTP’d to the site. This takes place every 5 minutes. Once the images are on my website. They are moved to archive sections via a scheduled cron job run on my webhost. The images are maintained for 7 days.
You can see the live helicorder page here.
A SHAKER COMMUNITY INSPIRATION
My third earthquake page was born from another share in the former Raspberry Shake Google Group. I came across this thread one day. I was very impressed that someone had come up with a way to view individual events detected by my Shake. I thought this would be a great way to communicate to those not seismically inclined, that earthquakes from halfway around the world, although not felt, could be detected in our community.
I do confess that I do not have the knowledge to write or even understand all that is going on in the code. Fortunately, it was set out in such a way that it was not too difficult to configure for my needs. However, it did involve a lot of trial and error until I was able to get everything to display correctly.

The Raspberry Shake data used in the script does not come directly from the Shake. The information comes from fdsnws.raspberryshakedata.com, and because of this there is a delay of about 30 minutes until the event data is available. The delay is just a slight draw back. Having the ability to display events captured by the Raspberry Shake over the past 90 days has been a wonderful addition to my website and you can see this page here.
RECEIVING SEISMIC ALERTS!
Sending information to my website is one use of the Shake data. However, as much as I enjoy watching a live view of the Shake data via swarm or WinSDR, I still have to go to work and engage with my family ?.
In order to help me break away from the screen, WinSDR has a feature to ‘trigger’ an action when an event is detected. The event detection involves comparing the Long Time Average (LTA) to the Short Time Average (STA) of a channel signal (I have seen use of the word Term in the place of Time also). I read about the concept here.
By experimenting with various combinations of LTA, STA, and average time, I ended up using these values on my filtered (0.3 to 3Hz) channel. The combination of STA/LTA values and filter frequencies provide the best detection of small local and distant large quakes for my local conditions and setup. I do receive the occasional false alarm (garage trucks or a nearby sprinkler valve opening), but the amount of false alarms is low.
Phone Notifications
What happens when an alert is triggered? WinSDR can do a few things. A seed file can be saved from the triggering event and the event can be highlighted in red on the helicorder. However, one feature I utilize is the execution of a .bat file. I wrote a .bat file that notes the time (local and UT) that the trigger occurred and sends a text via email to my phone.

I use SwithMail to send the text. This gives me the ability to receive a text message every time a trigger occurs. I can be out and about or at work and know when my Shake is detecting something. The trigger text often beats the USGS quake text by about 2 minutes.

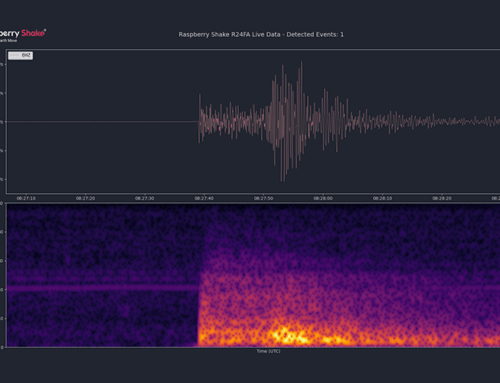
I was very happy receiving the text only alert. Then one day, it occurred to me. I could use SwamPlotter to generate a spec/wave images and have that image added to my alert text. By adding the images, I could get a quick indication of what my Shake had detected (real or false alarm, close or far away quake).
l did not make any changes to my original text only alert. I added an additional text message alert with the images attached that would be sent 50 seconds later. Why 50 seconds? This seems to be the right amount of time to record enough on the spec/wave images to determine what may have been detected. Less than 50 seconds, and not enough information is captured. More than 50 seconds seemed too long to wait (I can be a bit impatient at times).

After this modification, the alert texts now give me notice that something was detected and the general nature of the event. I can go back later in Swarm on WinSDR for a more detailed look at the event when I have time.
LIVE STREAMING
I knew about the concept of streaming live on YouTube, but never considered doing it. However, while viewing one of the local seismograph live streams during the Glen Avon swarm, I would describe what my Shake was recording using the stream’s chat window. Eventually, the stream owner suggested I stream my shakes’s data. He provided the name of the software he was using and a couple of other tips to get me going.
The next day, I downloaded the suggested streaming software OBS Studio and began to play and learn. There was a little bit of a learning curve to understand how to layout the screens used in the live stream. However, within a day or two, I felt I had a good enough layout to go live.
The first version of the stream only used WinSDR for displaying the live data. WinSDR also sounds an alarm tone when a possible quake is detected. I used a web browser to display the Shakeview map with the live data. I liked the basic view and I received good feedback on content. All the local Glen Avon quake displayed nicely in the view.
I started streaming in mid-June. Only two weeks later, the stream became very busy. July 4 and July 5 the Ridgecrest 6.4 and 7.1 occurred. Chino Hills is approx. 140 miles away from each. The signals, of course, maxed out the scale. It was impressive to see and feel. The 7.1 video can be seen here.
Viewing such a large event had me thinking. How do I display the more typical smaller quakes, but also display the larger events? If I set the fixed scale of WinSDR too large, smaller quakes will not be seen. Set the scale to low and many quakes will fill the graph. It took me a week or so, but I came up with a solution.
I decided to add the USGS Swarm application to the live stream. Swarm can be set to have a dynamic scale that snaps to the largest signal that is currently displayed. This would help show the details of small quakes and larger quakes could be seen in their entirety when the WinSDR graph has been filled. Swarm also allowed me to add a spectrograph view.
I settled on 10,000 counts for the fixed WinSDR scale. On average, most quakes fit in this range. I had a lot of test samples arrive to test this scale size. In the two weeks following the large Ridgecrest quakes, I was receiving a frequent amount of magnitude 3s and 4s from the area. Having a fixed scaled graph makes it easy to visually compare the relative strength of each quake that arrives at my location.

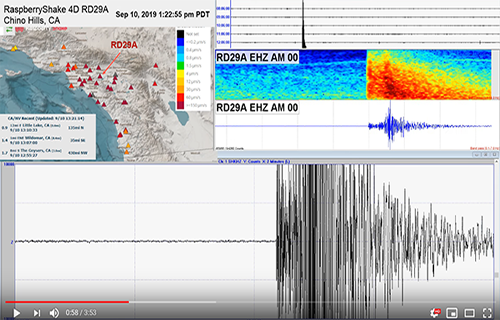
I am very happy with how the live stream has evolved. The stream can display both large or small quakes, along with their spectrograms. The live stream has been a great resource for me to watch things as they happen or go back and view a recent event. At the same time, the information is available for anyone that may be interested. You can see how all the views works together on this 4.0 from 35 miles away. The live stream and recorded events can be found here.
SHAKE INFORMATION FLOW
The following flow chart gives an overview of the data processes involved in my setup. Again, the diagram below and the information in this article is a high level image of what I have been able to do from what I have learned.

This is also an opportunity for me to give back to the Shake community and to share what I have found possible using the data from Raspberry Shake.
I want to thank those in the Raspberry Shake community that have shared what they have done and created. Without your efforts and ideas, I would not have been able to accomplish what I have achieved.
At Raspberry Shake we would like to once again say a massive thank you to Steve Caron for being such an active Shaker and for his willingness to share his experience and set up details with the rest of the Shaker community.