
")
Lesson 1: Get Shaking!
An Introduction to Seismology and Seismographs
Lesson Objective
Introduce students to the fundamental concepts of seismology, including:
- What seismology is and how seismographs work.
- How the geophone detects vibrations.
- The process of data collection, processing, and usage.
- Setting up and using a Raspberry Shake device.
(Note: While you may opt to set up the Shake beforehand, demonstrating the setup process in class can be a simple yet powerful way to engage students.)
Using a Raspberry Shake opens up interdisciplinary learning opportunities for all ages and grade levels. It connects with subjects like Earth Science, Physics, Computer Science, Engineering, and Mathematics. The Raspberry Shake is an excellent demonstration of how technology helps us interpret and interact with the natural world.
Classroom Preparation:
- Ensure your Raspberry Shake is ready and connected to the internet (setup instructions
available here ). - Provide students access to laptops or tablets with internet connectivity.
- Print student reading materials (optional)
Preparation Tip: Complete the Shake setup guide and review the Classroom Tips page before teaching with the Shake.
Learning Context/Anticipatory Set:
Introduce Raspberry Shake as an exciting, hands-on scientific tool for your classroom. Spark
curiosity by demonstrating its setup and displaying real-time seismic data. Follow these steps to
engage your students:
Steps for Engagement:
- Show the Shake to the class (unplugged).
- Plug the Shake in and observe the lights turning on.
- Open a browser and type rs.local to find your Shake. Navigate to StationView to view live data streaming.
- Gather the class, count down together, and jump as a group—watch the seismic activity
appear on screen in real time!
Follow up by going through this brief presentation to explain what Raspberry Shake is.
Key Terms
- Analog: Data produced by measuring continuous physical variables such as voltage or pressure.
- Anthropogenic: Caused or produced by human activity.
- Geologic Fault: A fracture or break in the Earth’s crust.
- Geophone: A sensor that detects ground vibrations
- Seismic: Related to ground movement.
- Seismic Wave: Acoustic energy that travels through Earth’s layers.
- Seismograph: A device that measures and records seismic movement.
- Seismometer: A precision sensor consisting of a mass suspended on a spring designed to detect and measure ground vibration.
Direct Instruction
What is seismology?
Seismology is the scientific study of seismic waves—waves of acoustic energy that ripple through the Earth. Just as microphones capture sound waves, seismographs measure seismic waves. These waves can originate from natural events like earthquakes, volcanic eruptions, or extreme weather, or from human activities such as construction, explosions, or traffic (known as anthropogenic seismicity).
What are Seismographs?
A seismograph is a tool that detects and records ground movement. At its core is a seismometer—a highly sensitive sensor featuring a mass suspended on a spring. When the Earth shakes, the frame moves with it, while the mass remains steady due to inertia. This relative motion generates analog signals, which a digitizer converts into digital data—displayed as frequency and amplitude on a screen.
Seismographs pick up a wide range of vibrations, from distant earthquakes to nearby footsteps or passing cars. Because of their sensitivity, they’re often placed away from busy areas to reduce “noise” from human activity. Around the world, seismographs play critical roles: seismologists use them to locate earthquake epicenters, volcanologists monitor magma movement, and geologists explore for oil and gas deposits underground.
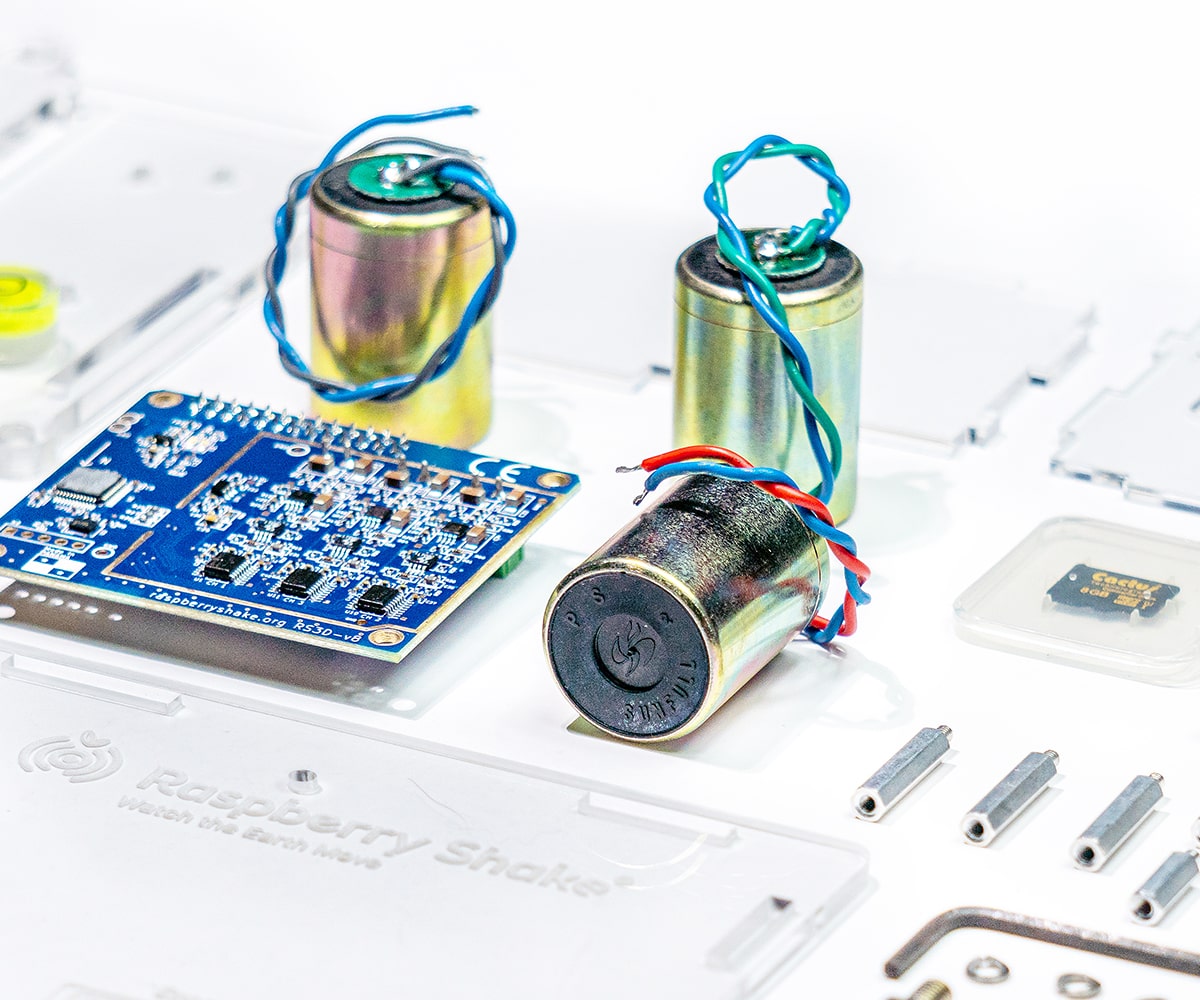
Understanding the Raspberry Shake: What is a Geophone?
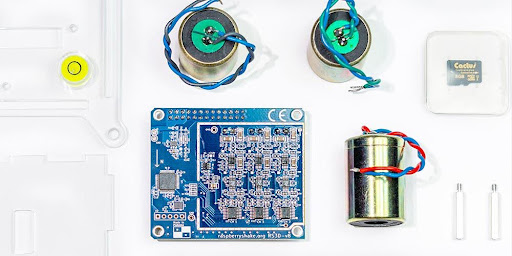
The heart of the Raspberry Shake is its geophone—a specialized seismometer sensor that acts like a low-frequency “ground microphone.” It transforms physical vibrations into electrical signals. Inside, a coil suspended on springs surrounds a magnet. When the ground moves, the coil shifts through the magnetic field, producing small analog voltages—positive (+) or negative (-) depending on the direction of motion. The stronger the vibration, the greater the current.
The Raspberry Shake’s built-in digitizer then converts these analog signals into digital data, making them visible on your computer as real-time seismograms. See Figure 1 for a diagram of the geophone’s inner workings.
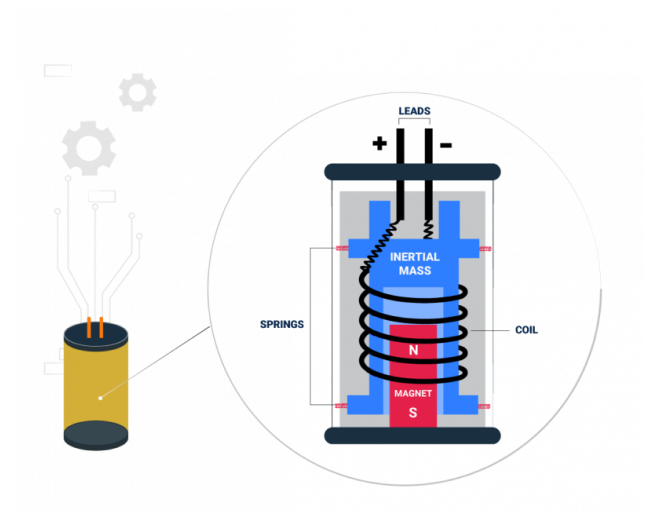
Figure 1: Cutted geophone and diagram of its parts.
How can we use our Shake?
The Raspberry Shake is a powerful tool for detecting and recording all types of ground vibrations, from natural phenomena like earthquakes to everyday anthropogenic noise such as traffic, fireworks, and even loud music. Its sensitive geophone ensures that even the smallest ground movements are detected.
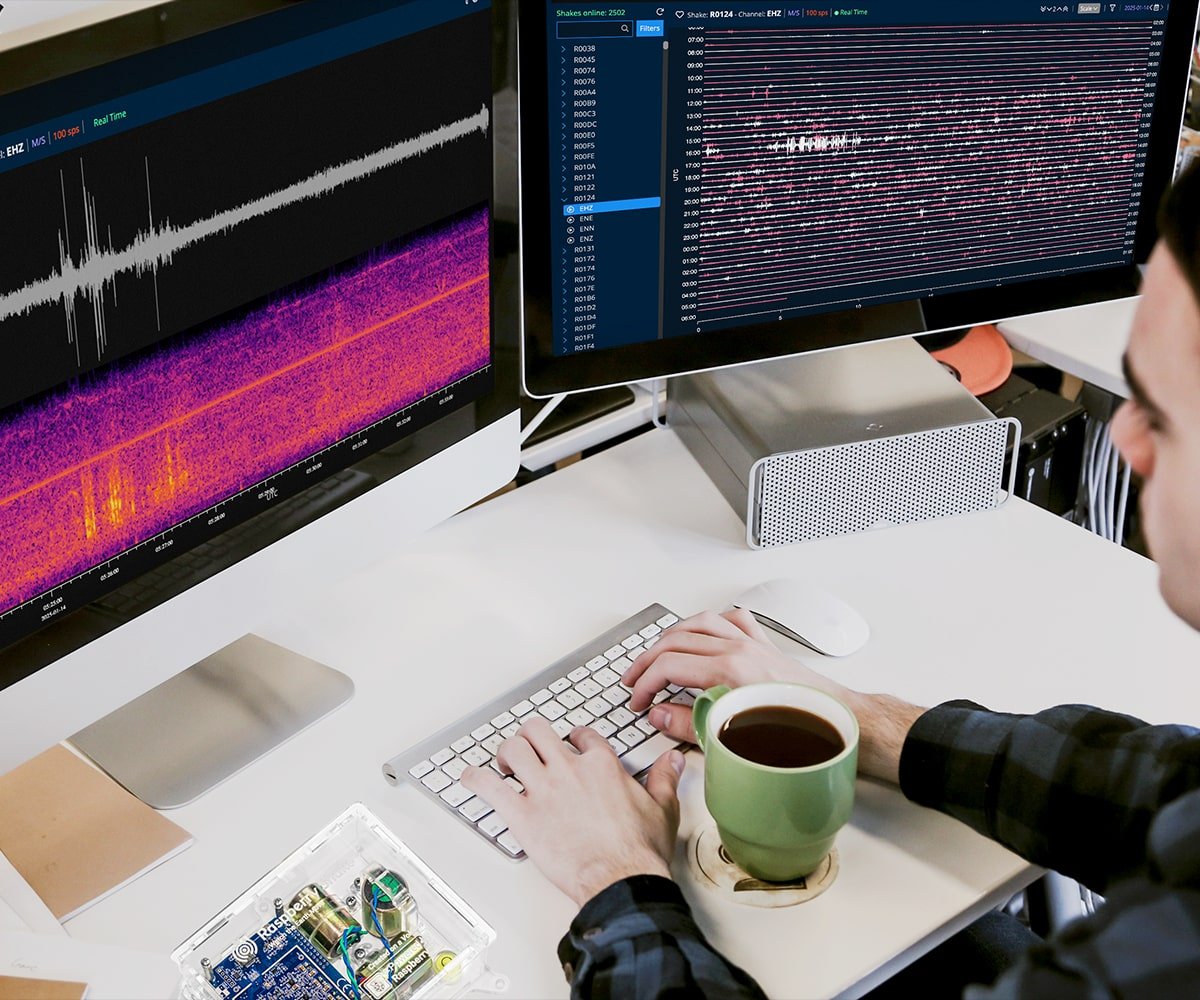
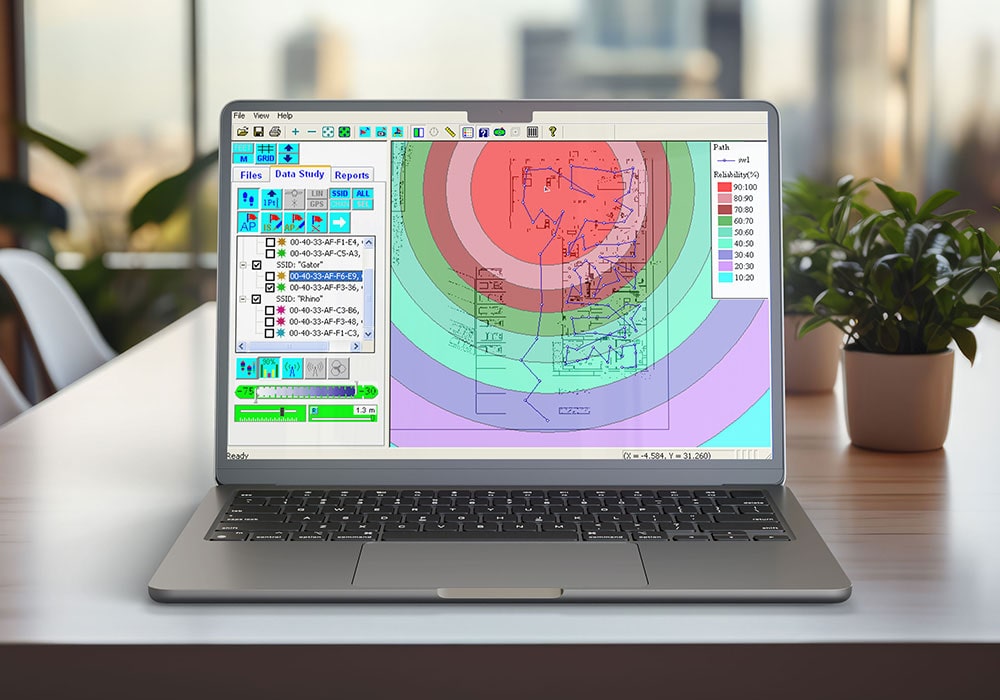
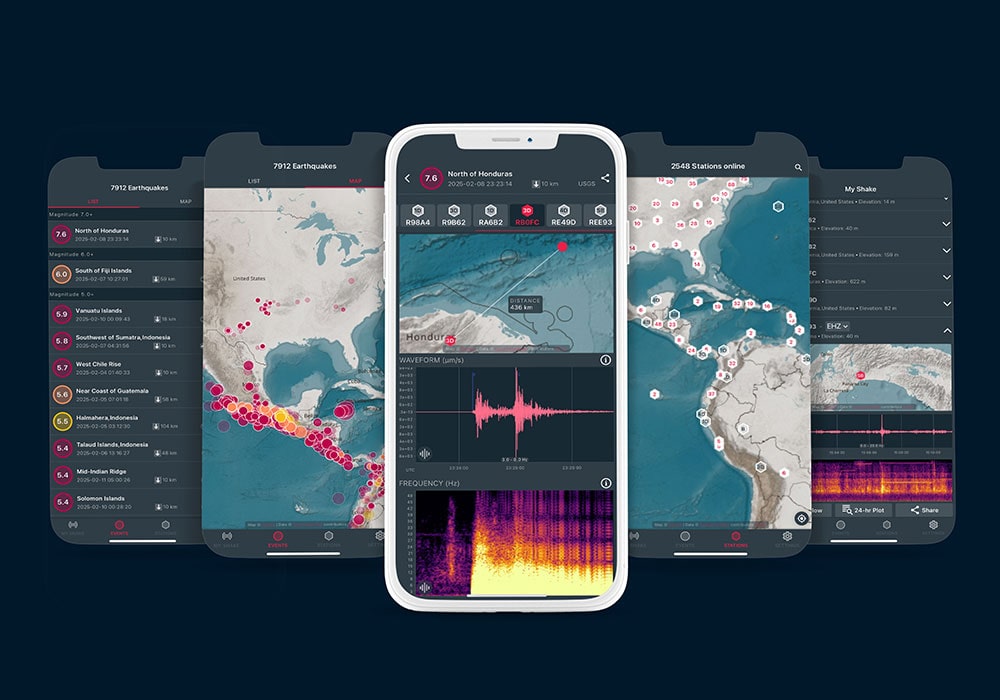
Visualizing and Analyzing Data
The Raspberry Shake connects to visualization tools like:
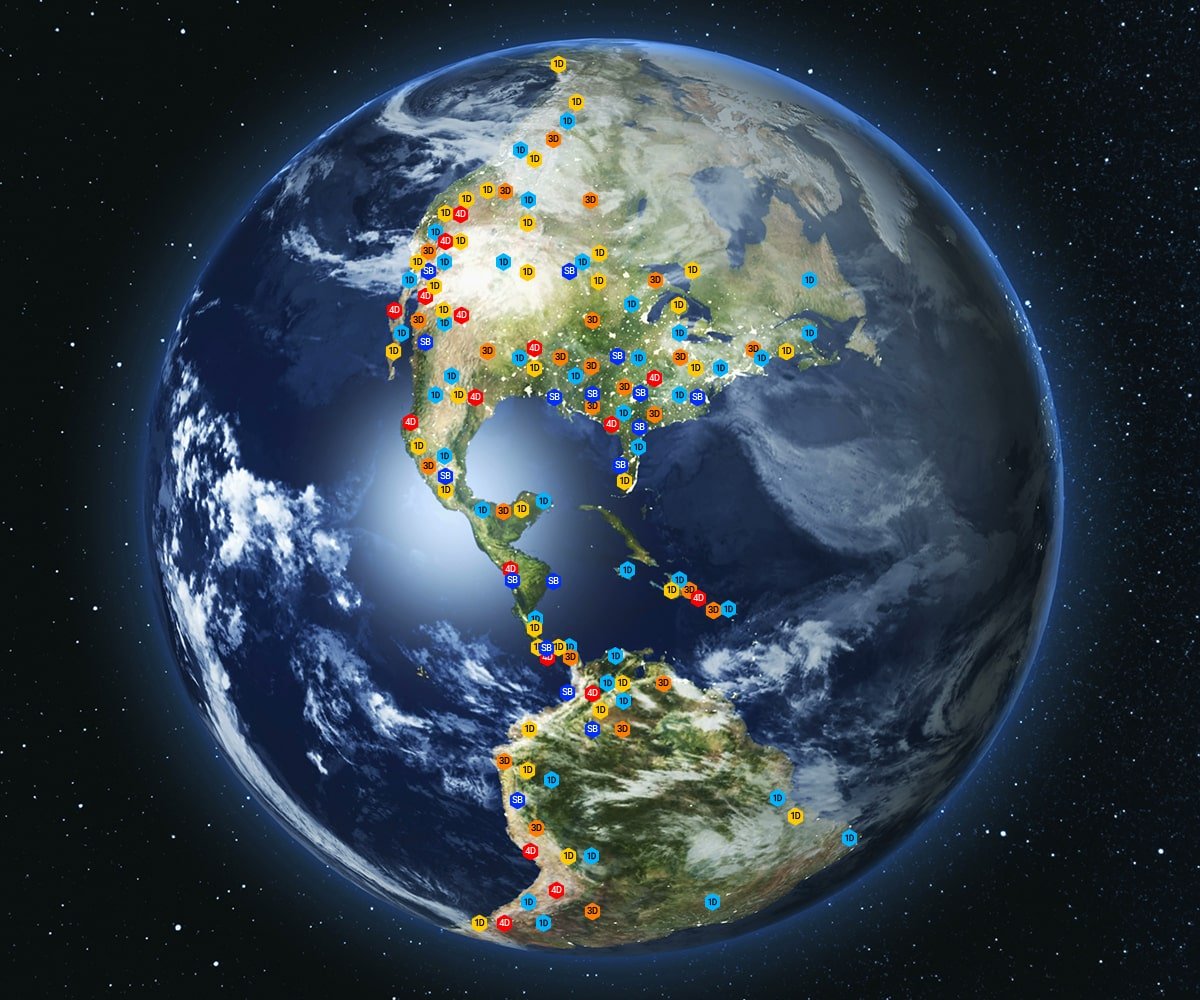
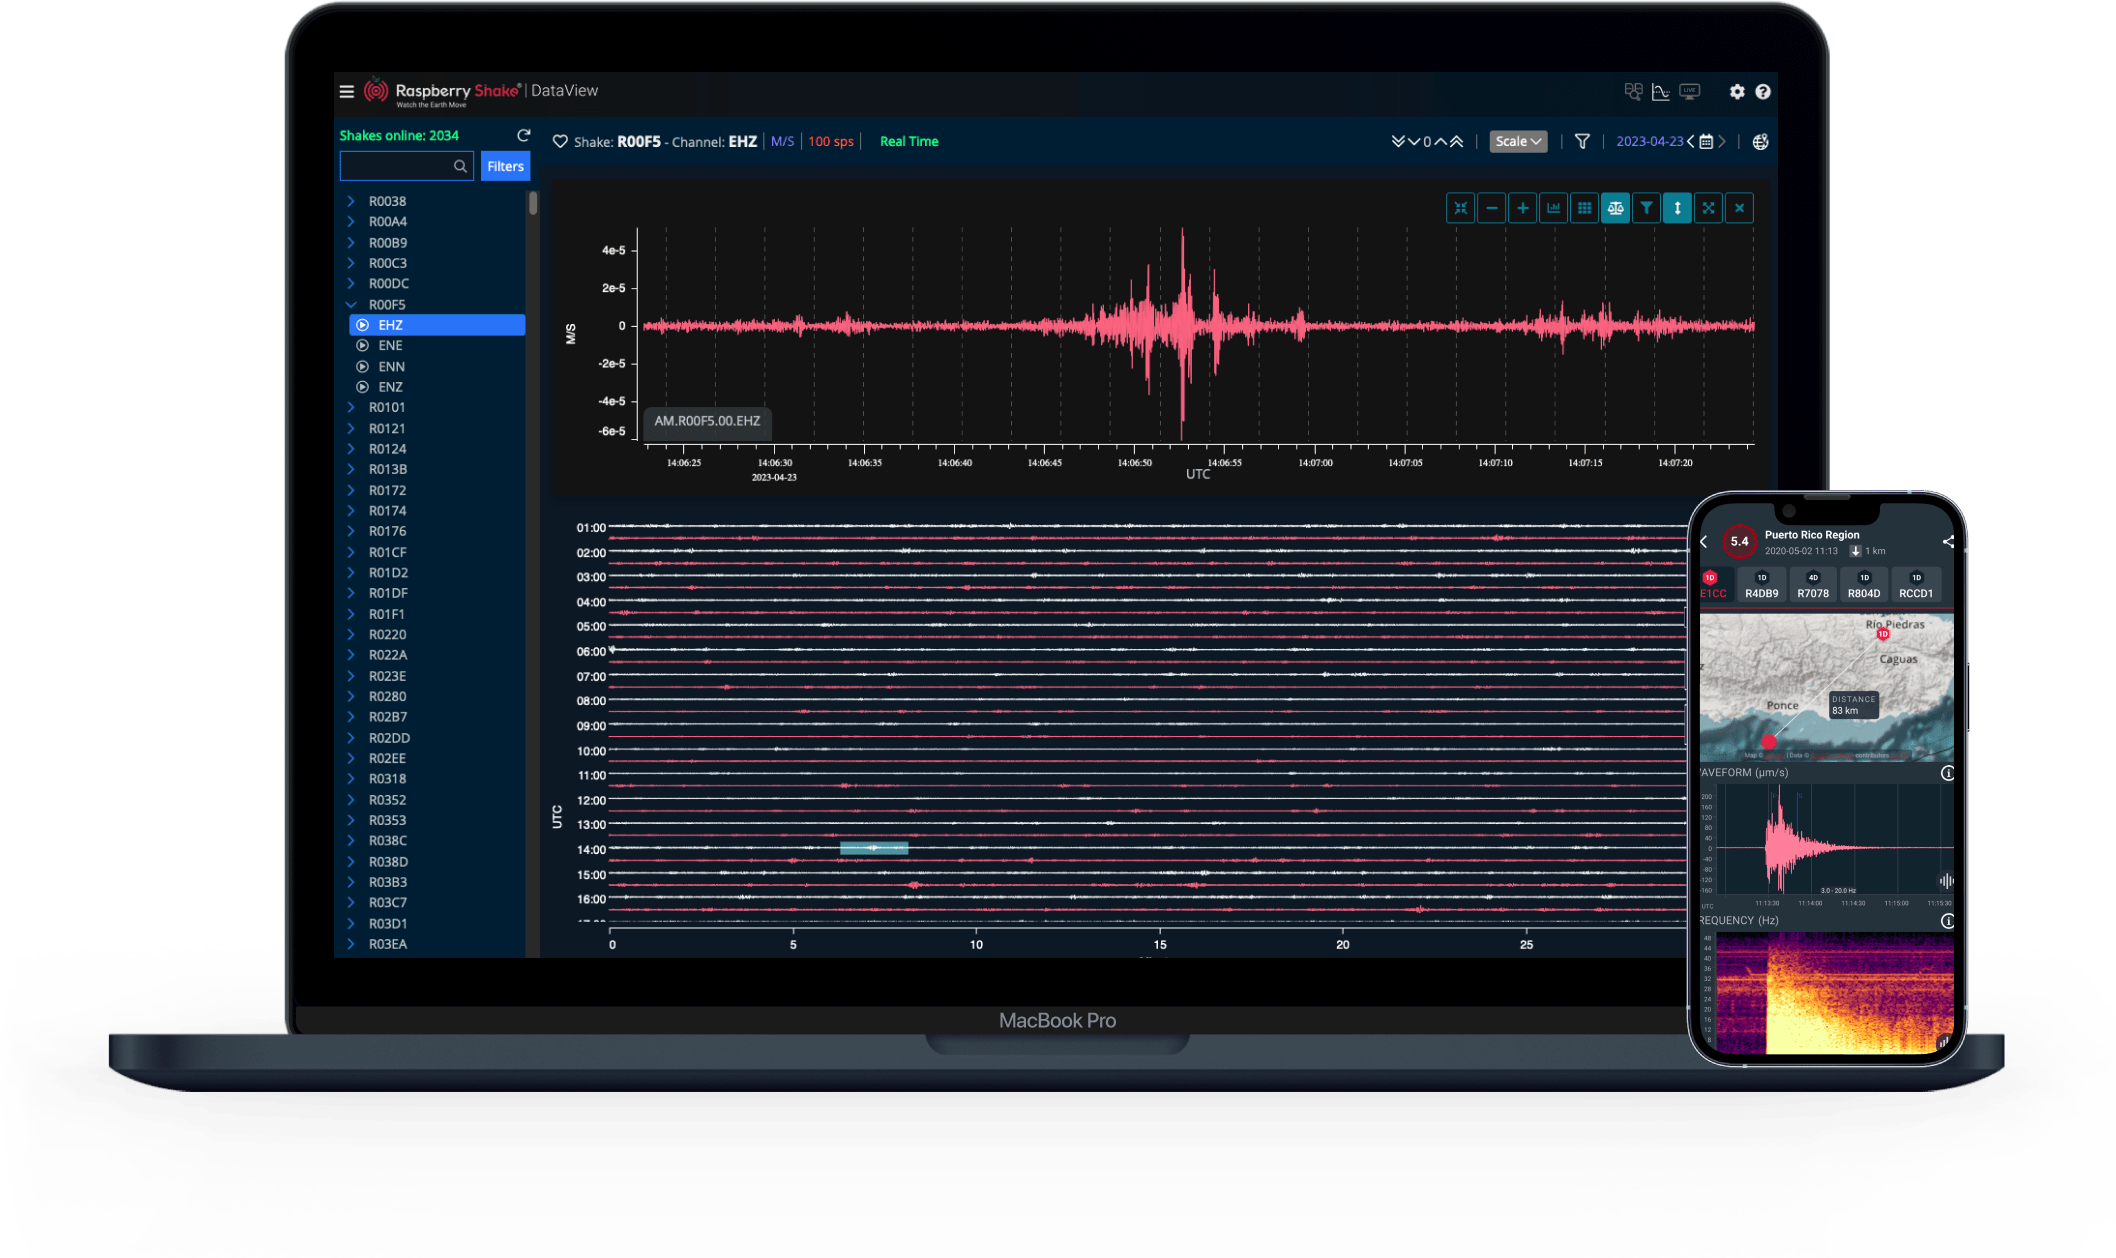
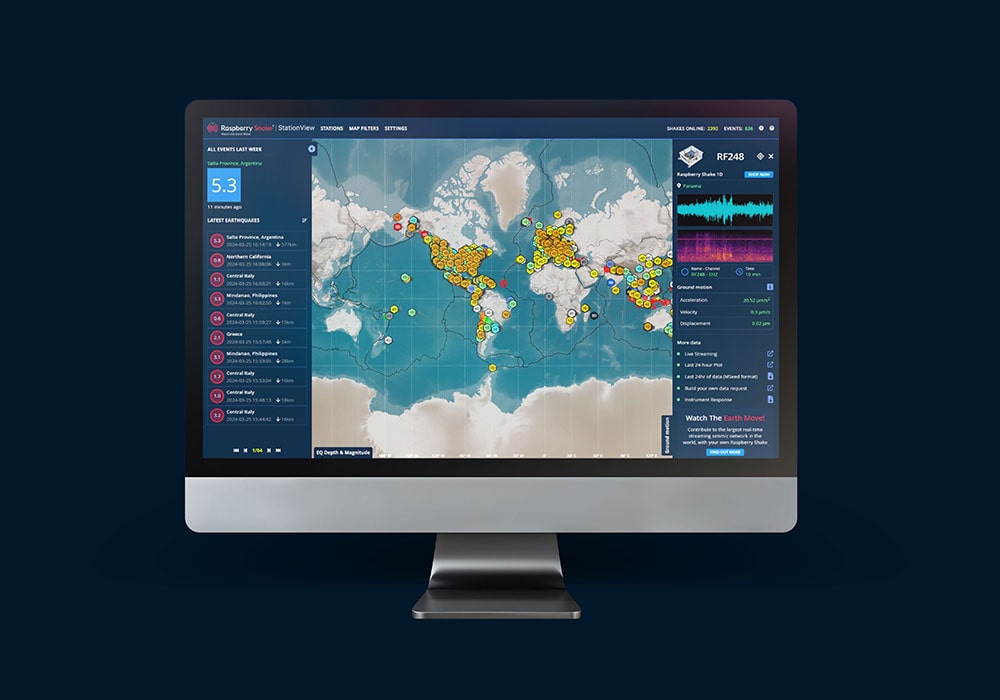
- Dataview: An interactive global map showcasing live data streams from Raspberry Shakes around the world.
- Stationview: A browser-based tool to explore seismic data, visualize seismograms and spectrograms, and analyze frequency patterns.
Through these tools, students can view and interpret real-time seismic data, gaining insights into seismic activity while connecting to a global network of seismic stations.
Beyond Earthquakes: Innovative Uses
Your classroom’s Raspberry Shake can detect much more than just earthquakes. Its ability to detect all types of ground vibrations has led to a range of creative and unexpected applications
- Cheer-Meter: The University of Michigan created a “cheer-meter” to measure which team received the loudest applause during sports events, even developing equations to calculate “Cheer Magnitude.”
- Elephant Communication: Researchers used Raspberry Shakes to monitor ground vibrations caused by elephants communicating in the African Savannah.
- Rocket Launches: The Shake has tracked vibrations from rocket launches and explosions, showcasing its sensitivity and range of applications.
These examples highlight the range of possibilities for using seismic data in new and creative ways. Just imagine how your students could explore the vibrations around them and come up with their own applications!
Practice
Time: Time: 10-15 Minutes — Explore Raspberry Shake allow students to navigate the Raspberry Shake software ecosystem, focusing on StationView and DataView.
- StationView: Explore the interactive global map to understand how each station contributes to the worldwide seismic network and view real-time data streams.
- DataView: Use the browser to visualize live seismic data, analyze patterns, and apply filters.
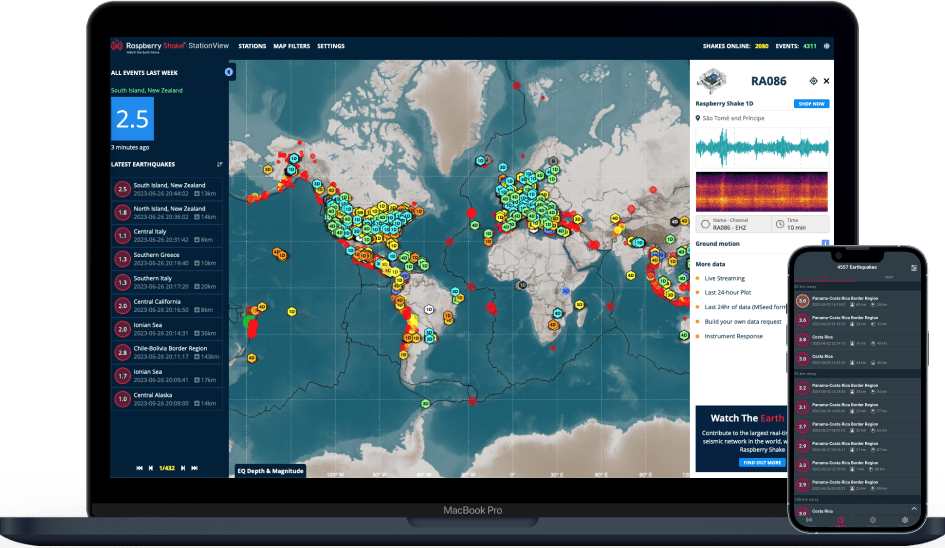
Figure 2: From left to right. DataView and StationView visualizing a specific station in California.
Closing
Time: 5-10 minutes — Planning for Future Applications
Option 1: Creative Brainstorming
In small groups, ask students to brainstorm potential uses for the Raspberry Shake in their own communities or schools, beyond detecting earthquakes. Examples could include:
- Measuring vibrations from nearby traffic or construction.
- Developing a “cheer-meter” for sports events or assemblies.
- Investigating environmental or human activities causing ground motion
Have groups share their best ideas with the class to spark excitement and creativity.
Option 2:
Explain that their Shake will become part of a global seismic network for monitoring earthquakes. Challenge students to identify the best location within the school for deploying the Shake. They should consider factors such as noise levels, power access, and internet connectivity. Commonly recommended locations include basements or quiet storage areas, which minimize external vibrations.
Lesson 2: Understanding Earthquakes
Dig Deeper into How Earthquakes are Interpreted
Lesson Objectives
By the end of this lesson, students will:
- Understand the basics of seismic activity and how earthquake waves propagate through the Earth.
- Learn how seismologists determine the location and magnitude of earthquakes using seismic data.
- Explore the technology behind seismic data processing and how it helps identify and interpret seismic waveforms.
Classroom Prep
- Ensure your Raspberry Shake is ready and connected to the internet (setup instructions
available here ). - Provide students access to laptops or tablets with internet connectivity.
- Print student reading materials (optional).
Preparation Tip: Educators should complete the Shake setup guide and review the Classroom Tips page before teaching with the Shake.
Learning Context
Begin the lesson by informing students that they will assume the role of seismologists. They will learn about triangulation and practice locating earthquakes, gaining insight into the physics behind earthquake waves and their propagation.
Key Terms
- Body Waves: Earthquake waves that travel through the Earth’s interior.
- Surface Waves: Earthquake waves that travel along the Earth’s surface.
- P-Waves: Primary (pressure) waves, which are the fastest traveling earthquake waves.
- S-Waves: Secondary (shear) waves, which are slower than P-waves.
- Triangulation: A method using data from three or more seismographs to identify earthquake epicenters by analyzing arrival times of P and S waves at various stations.
- Frequency: The rate at which waves repeat from peak to peak.
Direct Instruction
What Are Waves:
To interpret seismic data effectively, it is essential to understand the different types of waves involved. Waves are energy transfers through a medium, such as air or water, and in this context, they refer to seismic waves generated by earthquakes. All waves share key characteristics:
Wavelength: The distance between consecutive peaks in a wave.
Amplitude: The height of the wave from peak to trough.
Frequency: The number of wave cycles that occur in one second, measured in hertz (Hz).
Types of Seismic Waves
Types of Seismic Waves:
When an earthquake occurs, releases energy in the form of seismic waves that travel outward from the epicenter. There are two primary categories of seismic waves: body waves and surface waves.
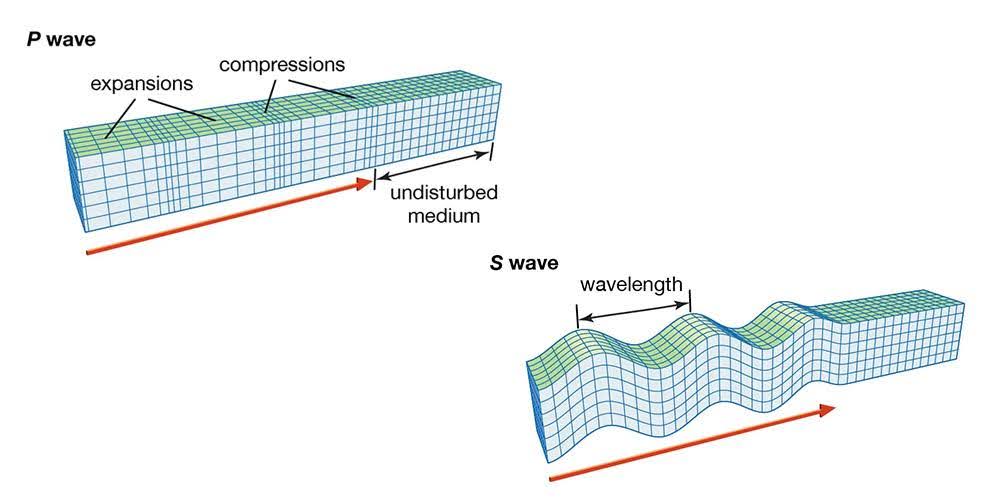
Body Waves: Body waves consist of P-waves and S-waves and travel through the Earth’s interior.
P-Waves (Primary Waves): P-waves, also known as compressional waves, are the fastest and first detected by seismographs as they push and pull material during propagation.
S-Waves (Secondary Waves): Also called shear waves are slower than P-waves and create side-to-side motion as they pass through materials.
Surface Waves: Travel along the Earth’s surface and arrive last. They move similarly to ocean waves and can cause the most destruction due to their amplitude and prolonged duration.
How Do Seismologists Interpret Seismic Data?
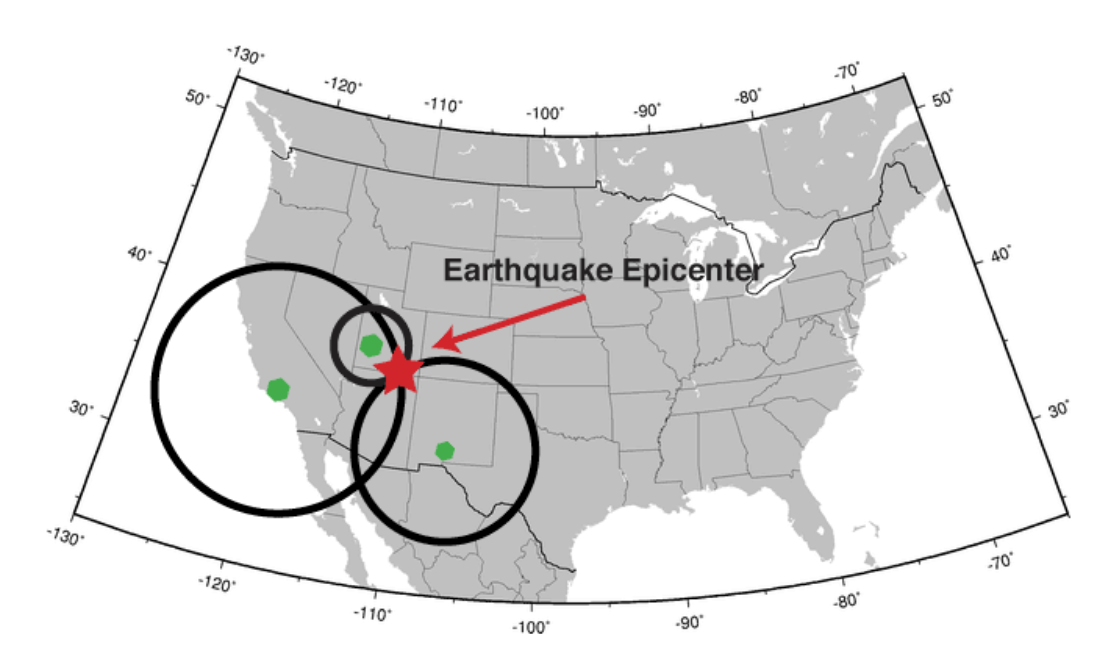
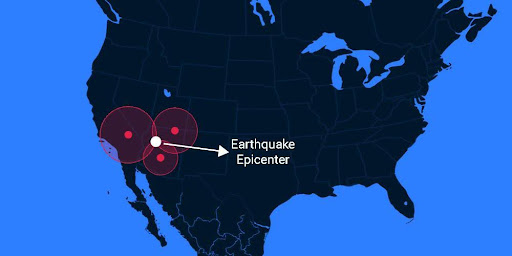
One of the most important tasks seismologists perform when a new earthquake is recorded is identifying its epicenter—the point on the Earth’s surface directly above where the earthquake originates.
To locate an earthquake’s epicenter, seismologists rely on a method called triangulation. By measuring the time difference between the arrival of P-waves and S-waves at three or more seismographs, they can calculate the distance from each station to the epicenter. The intersection of these distances pinpoints the earthquake’s location.
Closing
Time: 5 minutes
Class Discussion:
Volunteers can share with the class one thing they found challenging, and why.
Lesson 3: Computer Science with the Shake
Understanding Computer Science with Your Shake!
Lesson Objective
Utilize Raspberry Shake to explore core Computer Science principles and establish a foundation for future coding projects involving the Shake.
Classroom Preparation
- Ensure that your Raspberry Shake is set up and connected to the internet (instructions available here).
- Install Node-RED on a computer and familiarize yourself with its functionalities (installation guide).
- Create a ShakeMeter in Node-RED by following this tutorial.
- Provide students with access to computers with internet connectivity.
- Pre-install Node-RED on student computers (optional, this can also be done during class).
- Print student reading materials (optional).
This lesson plan assumes that educators have completed all necessary setup for the Raspberry Shake. Regardless of setup completion, it is advisable for educators to review our Classroom Tips page before beginning instruction.
Learning Context/Anticipatory Set
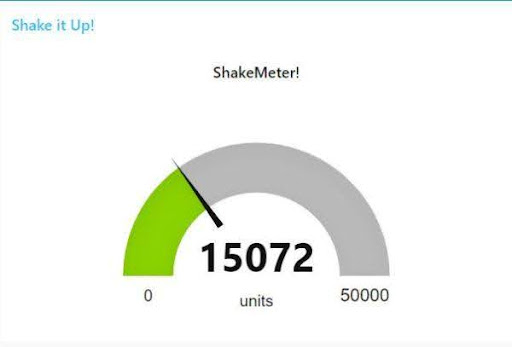
To capture students’ interest, display a live “Shakemeter” on your screen (instructions available here). Inform students that this lesson will delve into the exciting intersection of computer science and programming with the Shake!
Key Terms
- Computer: A device that accepts data as input, processes it using programs, and outputs the processed data.
- Input: Commands or signals received by a computer from external sources.
- Output: The signal sent from the computer to another device or displayed on a screen.
- Process: The execution of a computer program.
- Analog: Pertaining to continuous variations or transmissions of a signal.
- Digital: Relating to discrete measurements or approximations that can be stored by a computer.
- Network: A collection of interconnected computers for sharing resources.
- Internet: A global information system connected by unique addresses based on the Internet Protocol (IP).
- UDP (User Datagram Protocol): A protocol for sending data over a network.
Direct Instruction
Basics of Computer Science – with Raspberry Shake:
To effectively use the Raspberry Shake, students must grasp fundamental concepts of computer science. This lesson will cover these basics, laying the groundwork for future community projects. Let’s begin by addressing the question: “What is a computer?”
For an engaging introduction, consider sharing this informative video from Code.org.
In summary, computers take input (like data), process and store it with programs, and give output (like results on a screen).
It is crucial to recognize that all data handled by computers is digital, represented internally as ones and zeros. This binary data is encoded and decoded for human readability. In contrast, analog data represents continuous information through variable physical quantities. Digital data approximates analog data through a process called sampling—similar to connecting points along a curve in a connect-the-dots activity. While digital signals may not perfectly align with analog signals, they serve as effective approximations.
The Raspberry Shake shows this in action:
- The Raspberry Pi is the main computer, handling data.
- The geophone senses ground movement and turns it into analog voltage signals.
- The digitizer (on the Shake board) samples that voltage, converting it to digital data.
The class will take these concepts and use them as part of a coded program to process and display the Raspberry Shake’s UDP data!

Practice
Time: 20+ minutes — Start with Node-RED Connectivity
(If less than 20 minutes remain, consider closing this lesson and completing this activity in the next class.)Each student should access a laptop or Raspberry Pi to run a Node-RED server, working in pairs if desired. Follow this tutorial to get started.
Closing
Time: 5-10 minutes — Written Reflection
Students will write a brief reflection (3-5 sentences) on their learning experiences and insights gained during the lesson.
- Did today’s lesson change your perspective on computer science? If so, how?
- Did it increase your curiosity about coding? Why?
- Were there aspects that were difficult to understand? If so, what made them challenging?
Lesson 4: Programming a Shakemeter
Shake into the world of computer science with Node-Red!
Introduction to Programming with Node-Red
What is Node-Red?
Node-Red is a visual, flow-based programming language powered by JavaScript, ideal for introducing students to programming concepts. Unlike text-based languages like Python, it uses input, output, and function nodes—think of them as building blocks—to create “flows” that execute as programs. Similar to Scratch but more hardware-friendly, Node-Red runs easily on a Raspberry Pi (a small, single-board computer where it’s pre-installed) or any regular computer (with slightly more setup—click here for instructions). To use it, open a web browser on the device running Node-Red (the one processing the program) and enter localhost:1880 (or 127.0.0.1:1880) to access the workspace.
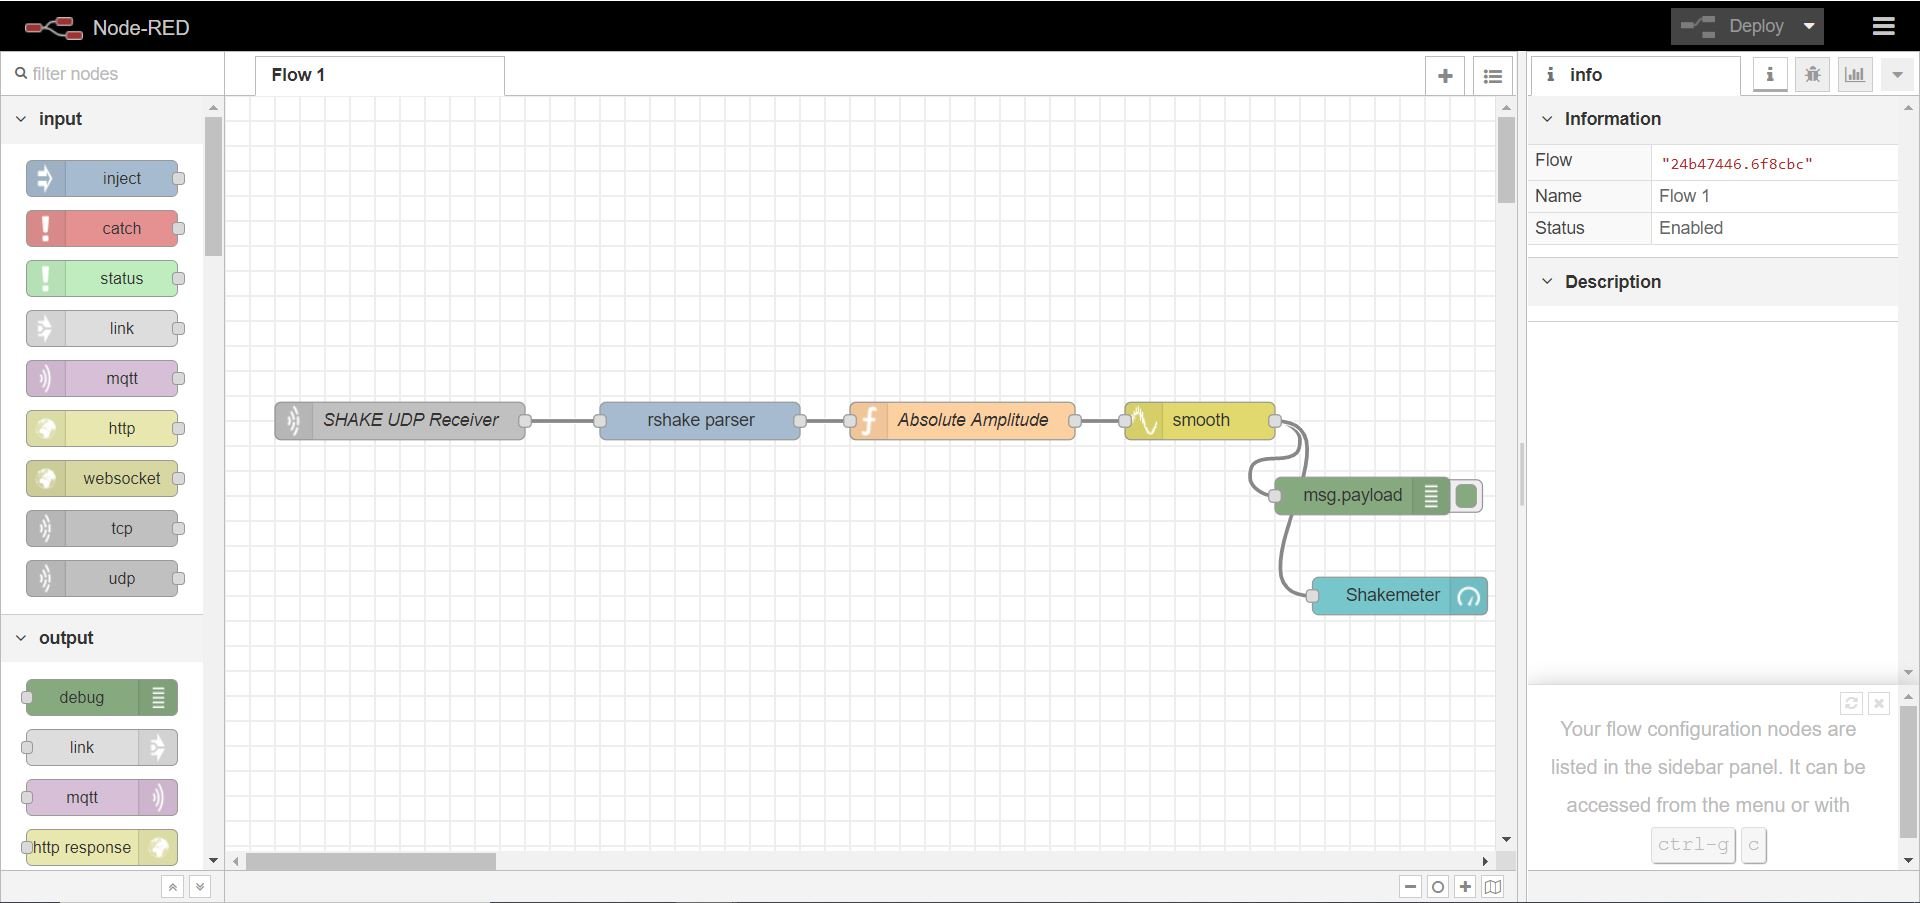
Figure 6: Example of Node-Red flow.
Node-Red Capabilities
Node-Red excels with Raspberry Shake, GPIO pins, websites, and networking. GPIO pins (General Purpose Input/Output pins) are small connection points on a Raspberry Pi or similar device that let you control or sense things like lights, buttons, or sensors—perfect for hands-on projects! Node-Red has the ability to send/receive emails and tweets and offers a Dashboard GUI (Graphical User Interface) that can contain everything from graphs and text to interactive buttons. Our Shakemeter, which you’ll build, uses this Dashboard.
What is UDP and How Does Raspberry Shake Use It?
Data travels over the internet via protocols—rules for sending and receiving information. Most of the time, when you download a file or send an email, it’s sent using Transmission Control Protocol (TCP), which is strict. TCP ensures data arrives in order and complete by requiring Acknowledgments—like sending a letter and asking, “Hey, did you get it?” and waiting for a “Yes” before moving on. If packets (small chunks of data) arrive out of order, TCP reorganizes them before delivery.
UDP, however, is a faster, one-way data stream with no Acknowledgments or re-sending—imagine shouting across a room instead of mailing a letter. If data arrives out of order or gets lost, UDP doesn’t fix it, which might sound unreliable but makes it very fast for local networks where issues are rare. UDP’s multicast feature lets Raspberry Shake send data to multiple devices at once, a powerful capability you’ll use in Node-Red to process live seismic data.
Connecting your Raspberry Shake to Node-Red
Video Tutorial: Connecting Raspberry Shake to Node-Red
- Ensure your Raspberry Shake and the device running Node-Red (e.g., your computer or Raspberry Pi) are on the same network—like the same Wi-Fi or wired connection—so they can “talk” to each other.
- Find the Node-Red device’s local IP address (a unique number like 192.168.1.100) using ifconfig (Linux) or ipconfig (Windows) in the terminal—a command-line tool on your device. This IP identifies your device on the network.
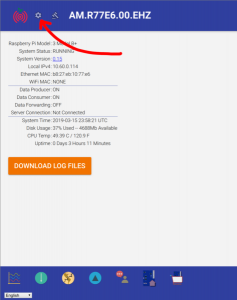
- Access your Shake’s web interface by typing rs.local into a browser on any device on the same network, then go to Settings > UDP STREAMS. This is where you tell the Shake where to send its data.
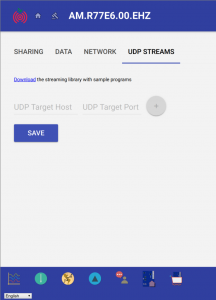
4. Enter the Node-Red device’s IP and port (default: 8888—a communication channel number). Click the “plus” icon to add it, then “Save” to confirm.
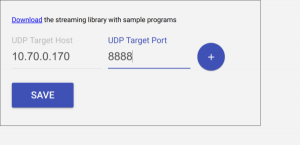
Important: Both devices must be on the same local network for the data to flow.
Reading the Stream in Node-Red
- Open Node-Red on your device and start with a fresh flow (a blank workspace). Drag in a UDP IN node from the node palette on the left—it’s under the “input” section.
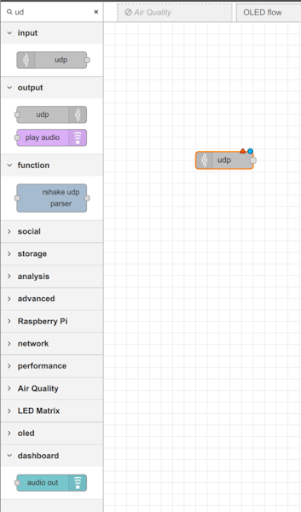
- Configure it to listen on port 8888 (matching the Shake’s setting), set output to “a String” (readable text, not “Buffer” which is raw data), and name it “UDP RECEIVER.” This node catches the Shake’s data stream.
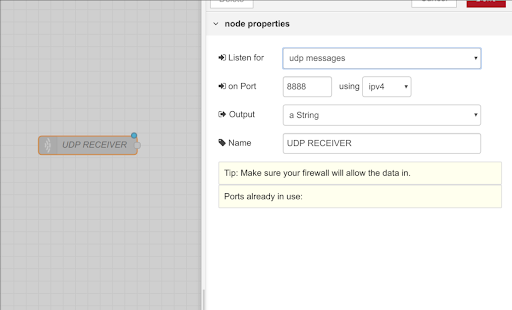
- Tip: Ensure your device’s firewall (a security feature that blocks unwanted traffic) allows port 8888—check with your IT person if data isn’t coming through.
- Connect a debug node (found under “output” in the palette) to the UDP RECEIVER. Deploy the flow (hit the red “Deploy” button top-right) and check the debug tab (right side) to see the data stream. If nothing appears, double-check both devices are on the same network.
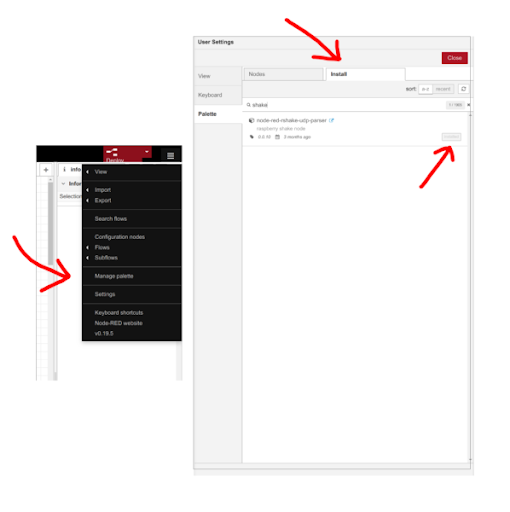
- Install the “Raspberry Shake Parser” node via Palette Manager (top-right menu > Manage Palette > search “shake”). It’s a special tool from the Raspberry Shake team to process UDP data.
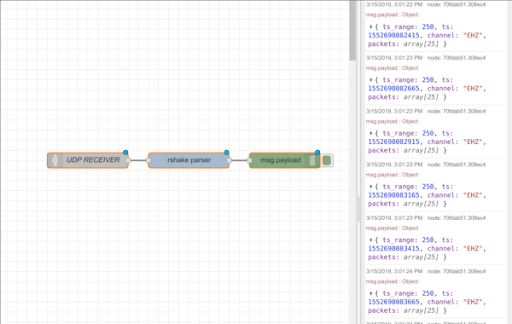
- Chain it to the UDP node to turn raw data into an object with properties. Using a debug node, we can examine the output. For example, the ‘channel’ property allows you to discriminate between different sensors on the Shake. (e.g., “EHZ” for Raspberry Shake 1D’s single sensor).
Congratulations! You’ve connected your Shake to Node-Red. Now, let’s build the Shakemeter!
Making a Shakemeter in Node-Red
Video Tutorial: Making a Shakemeter
Get ready to turn your Raspberry Shake’s data into action! The Shakemeter brings real-time ground motion to life, showing how strongly and quickly the earth shakes beneath your feet with a cool gauge on the Node-Red Dashboard. Watch the video tutorial above or follow the text instructions below to build your own.
First, confirm UDP data is flowing—check the debug tab to see the Rshake Parser’s object output, which includes various data types from the Shake.
Processing the Data
Add a function node to quantify shaking:
Copy to Clipboard
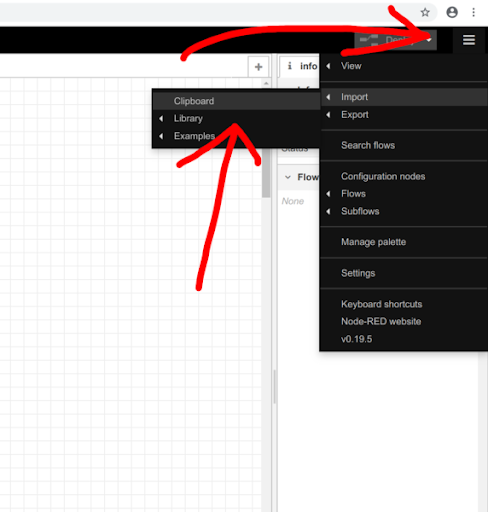
Import this code via the top-right menu > Import > Clipboard. Paste the code into the box that pops up. This “Absolute Amplitude” node calculates the average shaking strength by taking the absolute value of the data (ignoring direction, just measuring size) and averaging it. The “smooth” node then averages 25 readings to make the output steady and easier to read. (Note: Photos may show “Average Magnitude” instead.)
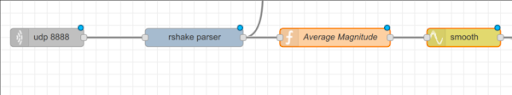
Your flow should now look similar to the image below. (Note: Image shows “average magnitude” in place of “absolute amplitude”):
Visualizing with Dashboard
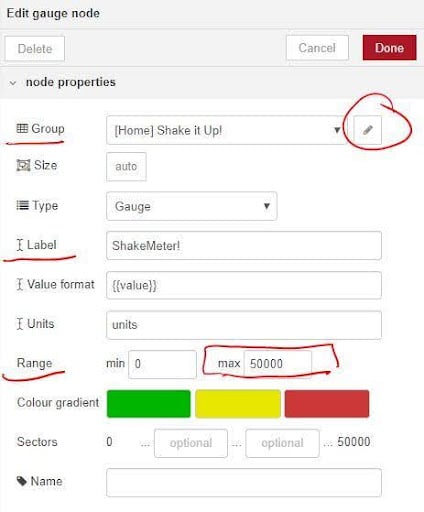
- Add a Gauge node (under “dashboard” in the palette) after the smooth node to display the data as a dial.
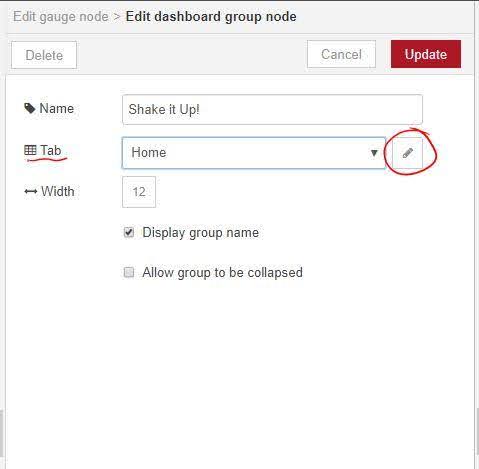
- Configure it: Set Range 0–50000 (no comma—write it as 50000), Label “ShakeMeter!”, Units “units,” and Group “[Home] Shake it Up!” If the group doesn’t exist, create it: click edit next to “Group,” then “Tab,” set Tab as “Home,” Width 12, then Update and Done.
Continue with your new skills and explore other projects you can do!
Keep Shaking!


Step into the Shoes of Seismologists
Discover the fascinating world of seismology with hands-on activities and expert-designed educational tools. Whether you’re a teacher, student, or enthusiast, our resources bring Earth science concepts to life.
