RASPBERRY SHAKES AND BOOMS RECORD THE DARNDEST THINGS
RESEARCH SEISMOLOGISTS, EDUCATORS, AND COMMUNITY SCIENTISTS COLLABORATE TO MONITOR AN INTRIGUING VARIETY OF EARTH-QUAKING EVENTS
July 6, 2022 – by Alan L. Kafka (Weston Observatory, Earth and Environmental Sciences, Boston College), Jay J. Pulli (Raytheon BBN Technologies), Kristi R. Fink (Texas Educational Seismic Project), Christopher Stapels (MathWorks), Kasey Cannon (Weston Observatory, Earth and Environmental Sciences, Boston College), Donald McCasland (Blue Hill Observatory and Science Center), Keith L. McLaughlin (Leidos Dynetics-LInC), Stephen R. McNutt (University of South Florida), Jacob N. Kafka (WeirdHat.com), Richard Block (Snow Star Farm), and Megan J. Sharkey (Boston College).

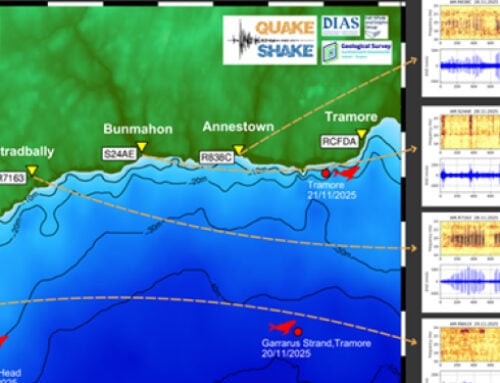
Figure 1: In addition to recording earthquakes, seismographs record lots of other things that shake
We usually think of seismographs as recording earthquakes, which of course they do, but they also record lots of other things that “shake”, such as activities of people and vehicle traffic near the seismograph site. In the case of typical research seismographs, we try to install them in seismically quiet places so that earthquake signals won’t be obscured by signals from other sources of seismic waves. Educational and community seismographs, by contrast, can be quite noisy because they are often purposely installed near people and other human cultural noise sources. We want our educational and community seismographs to be near where the people are so that people can interact with them directly. That can be a problem for seismic monitoring of earthquakes, but it’s not always bad for other aspects of seismology. One person’s noise is another person’s signal.
When we first (five years ago) became aware of the availability of the low-cost Raspberry Shake (RS) seismograph, we were intrigued about exploring how well it would record earthquakes. For the low cost of about $400 (compared with the thousands of dollars cost of research-grade seismographs), we were intrigued enough to buy some of them and see what they might record. As each of us bought, installed, and ran our RSs (and Raspberry “Booms” for recording infrasound, RBs), we evolved into the team of “Shakers” listed as coauthors of this blog post, a group of professional and community seismologists, mostly in the “Northeast Corridor” (NEC) of the Eastern United States. The NEC is a densely urbanized region surrounding the Amtrak rail line connecting Washington, Baltimore, Philadelphia, New York, New Haven, Providence, and Boston. Working in collaboration with the larger, global RS community, our NEC team of Shakers explored what these small, affordable RSs record, and we found a surprising and intriguing range of types of “things that shake” recorded on our RSs and RBs.
AND THAT’S THE WAY THE RASPBERRY SHAKES
We discovered that there was more interesting seismology recorded by these $400 instruments than we imagined possible. Yes, these little high-frequency earthquake sensors, integrated with some clever software on a Raspberry Pi computer, do record long-enough period signals for recording earthquakes very well. But these RSs also record a lot of other interesting seismic events, including storms, snow plows, wind turbines, street traffic, aircraft, construction sites, thunder, washing machines, and more. We also found that, in many cases, signal coherence of seismograms between nearby RS stations allows for advanced signal processing.
In 2021, we presented a poster at the Eastern Section Meeting of the Seismological Society of America (ES-SSA, Kafka, et al., 2021) showing examples of many diverse sources of ground shaking and infrasound we recorded with our RSs and RBs. Click on the links below to see the examples that were presented on our ES-SSA poster illustrating the variety of things recorded by our RSs located in the NEC:
- Magnitude 1.2 earthquake in Peabody, MA
- Six students jumping
- Quarry blast near Dulles Airport
- Magnitude 6.1 earthquake in the Macquarie Island region
- Magnitude 3.6 earthquake in New Bedford, MA
- Magnitude 7.2 earthquake in Haiti
- Lightning strike near Dulles Airport
- Helicopter flying overhead
- Magnitude 6.4 earthquake in Puerto Rico
- Traffic on Route 9 west of Boston
- Infrasound signals that we suspect are generated by wind turbines
- Array processing of signals from a magnitude 7.5 earthquake in Ecuador
- A Boston College football game
The variety and quality of what we are recording with our RSs in this region just keeps on increasing. Below in Figures 2-7, we show additional examples of our intriguing RS and RB recordings. Many more examples of what’s recorded with RSs and RBs are reported on various social media platforms, research publications, meeting posters and presentations, blogs, and online newsletters. See, for example, twitter.com/Weston_Quakes, where we post our RS recordings, along with other postings of seismological interest.
We found that RSs are surprisingly good for recording local and regional earthquakes and also record some large, distant earthquakes better than we expected. Plus, we are intrigued by the many other types of seismic sources recorded by our RSs that we are just beginning to explore. This experience highlights opportunities for community scientists, educators, and research scientists to collaborate in a broad impact endeavor to monitor and study an intriguing variety of earth-quaking events.
A GROWING RS AND RB DATABASE OF SEISMOGRAMS INSPIRING NEW IDEAS IN RESEARCH, EDUCATION, AND COMMUNITY SEISMOLOGY
The development of the Raspberry Shake project highlighted a great opportunity for seismology: You can put these $400 seismographs at some random place, and they will likely record an intriguing variety of seismic events. Here we describe just a small selection of the wide-ranging types of seismic sources we recorded at our NEC sites. Although some of our sites are in quiet places, the NEC being a densely urbanized region, many are located at noisy locations, typically wherever we were able to find a friendly colleague to host them. Nonetheless, filtering the seismograms to enhance the different frequency bands associated with the different types of sources is resulting in a growing database of RS and RB seismograms that promises to inspire new ideas for research seismologists, educators, and community scientists to explore these many earth-quaking events.
Low-cost seismographs offer opportunities for students and other community scientists to participate as research partners in the scientific community. These types of partnerships provide new ways for scientists to engage with a more public audience, making science more approachable to a wider audience. And, there is a growing number of examples of projects around the world where the overlapping missions of earthquake monitoring, research, science education, and community seismology are well integrated using RS seismographs. A few notable examples are projects in Haiti (e.g., Calais et al., 2019), Nepal (e.g., Subedi, et al., 2020), Oklahoma (e.g., Walter, et al., 2020), and Greenland (e.g., Jeddi, et al., 2020). These, and other, examples involve projects in which RSs are used to complement and densify existing seismic networks, lower detection thresholds for monitoring and studying earthquakes, engage and inform residents about earthquake hazards and preparation, and improve education in science, technology, engineering, and math for students of all ages.
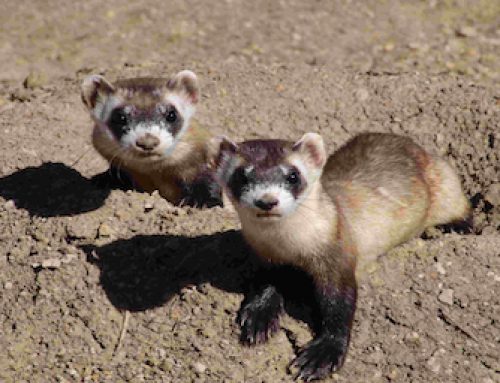
In addition to these earthquake-based projects, RSs and RBs are also now being used for interesting non-earthquake studies, such as tracking human activity associated with COVID-19 lockdowns (Lecocq, et al., 2020), assessing RS and RBs for recording African elephant acoustic vocalizations (Lamb et al., 2021), and helping populations of endangered ferrets recover (Cheyenne Mountain Zoo and Bogolub, 2022).
CONTINUING TO EXPLORE AN INTRIGUING VARIETY OF EARTH-QUAKING EVENTS
Research scientists, educators, and community scientists are just beginning to explore the wide range of types of seismic sources we have been recording with our RSs and RBs. Below we show just a small sample of examples from our NEC sites. We look forward to continuing our collaboration with the global community of Shakers as we all explore this emerging world of opportunities made possible by the development of these low-cost, high-quality seismographs.
In September 2021, a powerful magnitude 7.0 earthquake that occurred in Acapulco, Mexico was well recorded by our RS stations (Figure 2). By low-pass filtering our RS seismograms of this earthquake (<0.05 Hz), we can see the full waveform quite clearly, from the P-wave at about 01:54 to well-recorded (quite long-period) surface waves.
This earthquake generated an “Orange” USGS-PAGER alert for shaking-related fatalities (significant casualties are likely) and a “Red” alert for economic losses (extensive damage is probable and the disaster is likely widespread). The New York Times reported that power lines and buildings swayed for several seconds, residents rushed outside to seek safe ground, and some parts of Mexico City were left without power. Serious earthquakes like this one remind us of the importance of being sensitive in our roles as seismologists regarding the human tragedy caused by powerful earthquakes. It is always a challenge for seismologists to find the correct balance between conveying scientific information about “interesting” earthquakes, communicating our amazement at the incredible power of natural forces in the Earth, and remembering to be sensitive about the human tragedy caused by large earthquakes.

Figure 2: Earthquake in Acapulco, Mexico recorded at RS sites in the Northeast Corridor of the Eastern United States.
Bandpass filtering RS seismograms at frequencies ranging from about 0.1 Hz to 1 Hz enhances waveforms of P waves from distant earthquakes. An example of high-quality, research-grade data recorded with a low-cost RS seismograph is shown below in Figure 3, a magnitude 7.3 earthquake in Indonesia.
This earthquake was not near dense human population, so it was not strongly felt. But it shook the planet to the core… These recordings are of a seismic wave called “PKiKP”, which penetrates deep within the Earth’s outer core, is reflected off of the inner core, and arrives well-recorded at RS sites. This observation illustrates how (in 1936) the inner core was discovered by seismologist Inge Lehmann. Seismologists continue to study the details of “core phases” like that shown here to unravel the mysteries of the structure and dynamics of the Earth’s inner and outer core.

Figure 3: Four RS seismographs from a magnitude 7:3 earthquake in Indonesia. These recordings are of a seismic wave called ‘PKiKP’ which penetrates deep within the Earth’s core and arrives, well recorded, at the RS sites.
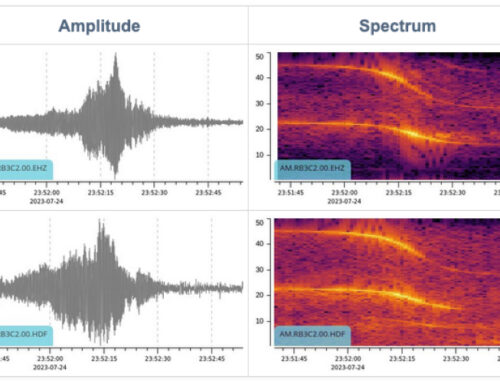
At the time shown here, Alan (sitting in his living room in Stoughton, MA) heard a loud helicopter overhead and felt a strong vibration. The bottom trace is from an RS in Alan’s basement, and the top trace is from one in his living room on the first floor. As the helicopter passes by, the RS records a doppler shift, with higher frequency content as it approaches, and lower frequency content as it flies away.
The colorful graphics shown below are “spectrograms”, which are a way of visualizing how the frequency content of vibrations in a seismogram changes over time. Spectrograms show how different frequencies of vibration appear at different times in the record. Red color represents stronger signals, and green color represents weaker signals. The doppler shift can be seen by the way that the red (strong) signals change from higher to lower frequency as the helicopter flies over the RS.

Figure 4: Seismograms and spectrograms of a helicopter flying overhead. The spectrograms show clear evidence of a doppler shift as the helicopter passes by. The top trace is from an RS on the first floor, and the bottom trace is from an RS in the basement.
An example of how community seismographs can be valuable in research is the Lecocq et al. (2020) study of global seismic quieting due to COVID-19 lockdowns. Thomas Lecocq of the Royal Observatory of Belgium, and 75 seismologist colleagues from around the world, analyzed hundreds of global stations, and about ¼ of those were RS community seismology sites. They made use of the community seismographs in noisy locations to complement other research seismographs in a study of changes in human activity around the world due to COVID-19 lockdowns.
When the COVID-19 lockdowns were imposed there was a drop-in human activity such as walking, driving, and use of public transportation. This meant there was a decrease in ways that humans create seismic vibrations of the Earth beneath our feet. Lecocq et al. (2020) were thus able to, with the help of RS seismographs, quantify the decrease in global human activity due to the pandemic lockdowns. This demonstrated the possibility of using RS community seismographs to help monitor the effectiveness of COVID-19 lockdown measures. Note that the actual well-coordinated lockdown measures only lasted a few months.

Figure 5: Fluctuation of seismic noise recorded by R57EC (black), along with Google mobility data (red) for an RS site on the Boston College campus (4-hr smoothing, 8-11 Hz). Processed with Matlab software developed by Jay Pulli. The seismic quieting after lockdown times, and evidence of a return to higher levels of human activity in more recent months, are clearly observed.
On January 15, 2022, the Hunga Tonga-Hunga Ha’apai volcano in the Kingdom of Tonga generated a huge volcanic eruption. This was the Earth’s largest volcanic eruption in the past three decades and was the largest atmospheric explosion ever recorded by modern technology. It was strong enough to send out infrasound signals that were recorded around the world. Figure 6 shows infrasound data we recorded from the Tonga eruption with our RBs in Miami FL and Weston, MA, and across the Washington, DC area.


Figure 6: (Above) Infrasound recordings of the huge January 15, 2022 Tonga volcanic eruption at RB sites in Miami, FL and Weston, MA. (below) Tonga volcanic eruption recorded at RB sites across Washington, DC area.
We operate two RSs on the Boston College campus, one in Devlin Hall (location of the Department of Earth and Environmental Sciences) and one in the Conte Forum athletics center. Conte Forum is adjacent to the BC football stadium, where the BC commencement is held. The commencement activities are recorded by the Conte Forum RS (Figure 7).
Recording commencement activities, football games, and other athletic events, and posting the results on social media, provides opportunities for engaging the broader community (beyond just science majors) in the work of our geophysics majors, graduate students, and faculty. Commencement means a beginning. We are just beginning to embark on this adventure…

Figure 7: Boston College Commencement recorded by RA2DE in the Conte Forum athletics center.
REFERENCES AND FURTHER READING
Calais, E., et al. (2019, including 15 coauthors). Monitoring Haiti’s Quakes with Raspberry Shake, eos.org/science-updates/monitoring-haitis-quakes-with-raspberry-shake, May 12, 2019.
Cheyenne Mountain Zoo, and K. Bogolub (2022). Using a Raspberry Shake to Help the Endangered Black-Footed Ferrets Recover, Colorado Geological Survey, Blog for Raspberry Shake website, raspberryshake.org/news/using-raspberry-shake-to-help-endangered-black-footed-ferrets, June 8, 2022.
Kafka, A.L. , J.J. Pulli, K.R. Fink, C. Stapels, K. Cannon, D. McCasland, K. McLaughlin, J.N Kafka, R. Block, and M . Sharkey (2021). The Intriguing Variety of Things We Record with Our Raspberry Shakes: Citizen Scientists, Educators, and Research Scientists Collaborating to Monitor Our Active Planet, Eastern Section Meeting, Seismological Society of America, Atlanta, GA, October 19-20, 2021.
Kafka, A.L. (2021). Lessons from COVID-19 Lockdowns with Raspberry Shakes, Blog for Raspberry Shake website, raspberryshake.org/lessons-from-covid-19-lockdown-with-raspberry-shakes, January 18, 2021.
Kafka, A.L., and J.J. Pulli (2020). The COVID-19 Seismic Noise Quiet as Seen by Two Raspberry Shake Seismographs Located at Boston College, Abstract presented at the Fall 2020 Meeting of American Geophysical Union, “Online Everywhere”, December 1-17, 2020.
Lamb, O.D., M.J. Shore, J.M. Lees, S.J. Lee, and S.M. Hensman (2021). Assessing Raspberry Shake and Boom Sensors for Recording African Elephant Acoustic Vocalizations. Front. Conserv. Sci. 1:630967. doi: 10.3389/fcosc.2020.630967
Lecocq, T., et al. (2020, including 75 coauthors). Global Quieting of High-Frequency Seismic Noise Due to COVID-19 Pandemic Lockdown Measures, Science, 10.1126/science.abd2438.
Jeddi, Z, P.H. Voss, M.B. Sørensen, F. Danielsen, T. Dahl-Jensen, T.B. Larsen, G. Nielsen, A. Hansen, P. Jakobsen, and P.O. Frederiksen (2020). Citizen Seismology in the Arctic, Frontiers in Earth Science 8:139, doi: 10.3389/feart.2020.00139.
Pull, J.J., and A.L. Kafka (2020). Decrease in High-Frequency Background Seismic Noise After the COVID-19 Lockdown at a Suburban Site Outside Washington DC, Abstract presented at the Fall 2020 Meeting of American Geophysical Union, “Online Everywhere”, December 1-17, 2020.
Subedi, S., G. Hetényi, and R. Shackleton (2020). Impact of an educational program on earthquake awareness and preparedness in Nepal, Geoscience Communication, 3, 279– 290, https://doi.org/10.5194/gc-3-279-2020.
Walter, J.I., P. Ogwari, A. Thiel, F. Ferrer, I. Woelfel, J.C. Chang, A.P. Darold, and A.A. Holland (2020). The Oklahoma Geological Survey Statewide Seismic Network, Seismological Research Letters, 91(2A), 611-621, doi.org/10.1785/0220190211
Here at Raspberry Shake we would like to thank Alan L. Kafka, Jay J. Pulli, Kristi R. Fink, Christopher Stapels, Kasey Cannon, Donald McCasland, Keith L. McLaughlin, Stephen R. McNutt, Jacob N. Kafka, Richard Block, and Megan J. Sharkey for this amazing article with this incredible project. We wish you all the best and look forward to updates on this project and further collaborations like this.